
The BRICS nations, originally composed of Brazil, Russia, India, China and South Africa, have had many discussions about establishing a new reserve currency backed by a basket of their respective currencies.
The creation of a potentially gold-backed currency, known as the ‘Unit,’ as a US dollar alternative is also under consideration by BRICS members. However, whether or not these countries can fully separate themselves from the ruling global currency is up for debate even amongst themselves.
A potential BRICS currency would allow these nations to assert their economic independence while competing with the existing international financial system. The current system is dominated by the US dollar, which accounts for about 89 percent of all currency trading. Traditionally, nearly 100 percent of oil trading was conducted in US dollars; however, in 2023, one-fifth of oil trades were reportedly made using non-US dollar currencies.
Central to this situation is the US trade war with China, as well as US sanctions on China and Russia. Should the BRICS establish a new reserve currency, it would likely significantly impact the US dollar, potentially leading to a decline in demand, or what’s known as de-dollarization. In turn, this would have implications for the US and global economies.
If BRICS watchers were hoping for more fireworks at the 2025 BRICS meeting held in Brazil this July, they were sorely disappointed. Putin and Chinese President Xi Jinping were not in attendance, and talk of a BRICS currency was much more muted. On top of this, according to Modern Diplomacy, that topic may be even less of a concern at next year’s BRICS meeting; it will be held in India, which has sought to distance itself from a move away from the US dollar.
It’s still too hard to predict if and when a BRICS currency will be released, but it’s a good time to look at the potential for a BRICS currency and its possible implications for investors.
Why do the BRICS nations want to create a new currency?
The BRICS nations have a slew of reasons for wanting to set up a new currency, including recent global financial challenges and aggressive US foreign policies. They want to better serve their own economic interests while reducing global dependence on the US dollar and the euro.
In recent years, the US has placed numerous sanctions on Russia and Iran. The two countries are working together to bring about a BRICS currency that would negate the economic impacts of such restrictions, as per Iranian Ambassador to Russia Kazem Jalal, speaking at a press conference during the Russia-Islamic World: KazanForum in May 2024.
In December 2025, the foreign ministries of Russia and Iran signed a deal for a three-year consultation program to further coordinate their resistance to Western sanctions.
Some experts believe that a BRICS currency is a flawed idea, as it would unite countries with very different economies. There are also concerns that non-Chinese members might increase their dependence on China’s yuan instead. That said, when Russia demanded in October 2023 that India pay for oil in yuan as Russia is struggling to use its excess supply of rupees, India refused to use anything other than the US dollar or rupees to pay.
While Russia and Iran are primarily advocating for a single unified currency, the other BRICS nations are more interested in developing interoperable digital payment systems.
When will a BRICS currency be released?
There’s no definitive launch date, although BRICS leaders have discussed the possibility at length.
During the 14th BRICS Summit, held in mid-2022, Russian President Vladimir Putin said the BRICS countries plan to issue a ‘new global reserve currency,’ and are ready to work openly with all fair trade partners.
In April 2023, Brazilian President Luiz Inacio Lula da Silva showed support for a BRICS currency, commenting, “Why can’t an institution like the BRICS bank have a currency to finance trade relations between Brazil and China, between Brazil and all the other BRICS countries? Who decided that the dollar was the (trade) currency after the end of gold parity?”
In the lead up to the 2023 BRICS Summit, there was speculation that an announcement of such a currency could be on the table. This proved to be wishful thinking, however. ‘The development of anything alternative is more a medium to long term ambition. There is no suggestion right now to creates a BRICS currency,’ Leslie Maasdorp, CFO of the New Development Bank, told Bloomberg at the time. The bank represents the BRICS bloc.
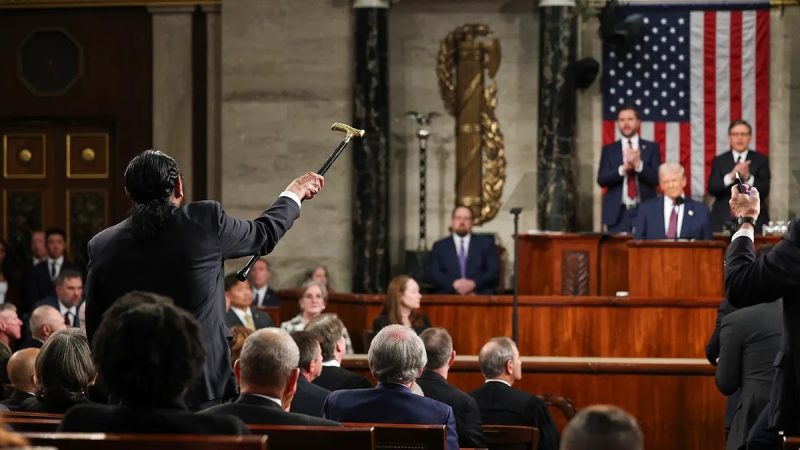
At the 2024 BRICS Summit, the movement away from US dollar supremacy really came to a head when Russian President Vladimir Putin appeared on stage holding what appeared as a prototype of a possible BRICS banknote.
However, he soon backed away from his previous aggressive calls for de-dollarization, stating the goal of the BRICS member nations is not to move away from the US dollar-dominated SWIFT platform, but rather to deter the ‘weaponization’ of the US dollar by developing alternative systems for using local currencies in financial transactions between BRICS countries and with trading partners.
Government officials in Brazil, which took the rotating presidency of the BRICS group for 2025, have said there are no plans to take any significant steps toward a BRICS currency.
‘We are not refusing, not fighting the dollar, but if they don’t let us work with it, what can we do? We then have to look for other alternatives, which is happening,’ Putin told listeners.
However, measures to reduce the reliance on the US dollar are very much on the table with cross-border payment systems, including exploring blockchain technology, a major theme at the 2025 BRICS summit, reported Reuters.
As mentioned, in 2026, the BRICS Summit will be held in India, which earlier this year distanced itself from the idea of a move away from the US dollar. Speaking at an event in London in March 2025, India’s External Affairs Minister S. Jaishankar stated, ‘I don’t think there’s any policy on our part to replace the dollar. The dollar as the reserve currency is the source of global economic stability, and right now what we want in the world is more economic stability, not less. I don’t think there’s a unified BRICS position on this. I think BRICS members, and now that we have more members, have very diverse positions on this matter.’
Which nations are members of BRICS?
As of early 2026, there are 10 BRICS member nations: Brazil, Russia, India, China, South Africa, Egypt, Ethiopia, Indonesia, Iran and the United Arab Emirates (UAE). This expanded group of 10 full member countries is sometimes referred to as BRICS+.
The group was originally composed of the four nations of Brazil, Russia, India and China and called BRIC, which changed to BRICS when South Africa joined in 2010.
At the 2023 BRICS Summit, six countries were invited to become BRICS members: Argentina, Egypt, Ethiopia, Iran, Saudi Arabia and the UAE. All countries but Argentina and Saudi Arabia officially joined the alliance in January 2024, and in 2025, Indonesia became the 10th full member of BRICS.
Additionally, at the 2024 BRICS Summit, 13 nations signed on as BRICS partner countries, although they are not yet full-fledged members: Algeria, Belarus, Bolivia, Cuba, Kazakhstan, Malaysia, Nigeria, Thailand, Turkey, Uganda, Vietnam and Uzbekistan.
Saudi Arabia has seemingly been on the fence about joining the BRICS. The Crown Prince Mohammed bin Salman’s November 19, 2025, announcement of a US$1 trillion investment in the US economy during a visit to the White House may signal something about the Middle Eastern country’s allegiance.
What would the advantages of a BRICS currency be?
A new currency could have several benefits for the BRICS countries, including more efficient cross-border transactions and increased financial inclusion. By leveraging blockchain technology, digital currencies and smart contracts, the currency could revolutionize the global financial system. Thanks to seamless cross-border payments, it could also promote trade and economic integration among the BRICS nations and beyond.
A new BRICS currency would also:
- Strengthen economic integration within the BRICS countries
- Reduce the influence of the US on the global stage
- Weaken the standing of the US dollar as a global reserve currency
- Encourage other countries to form alliances to develop regional currencies
- Mitigate risks associated with global volatility due to unilateral measures and the diminution of dollar dependence
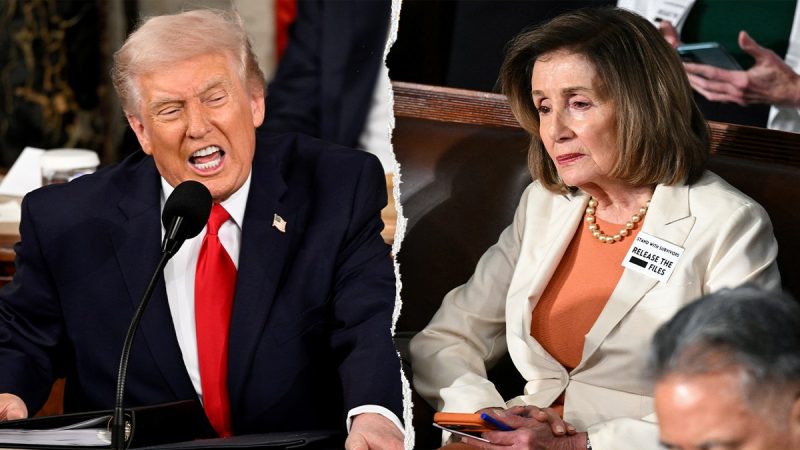
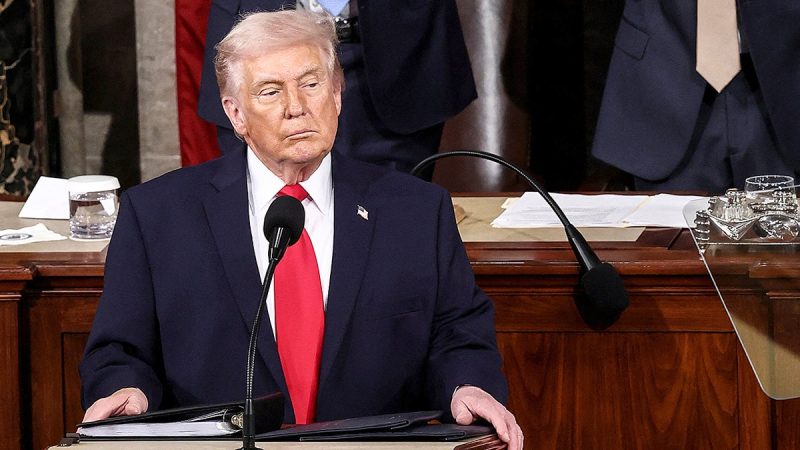
What is Donald Trump’s stance on a BRICS currency?
Trump has not been shy about upping the ante on American protectionism with tariffs. During the first US presidential debate between him and Vice President Kamala Harris on September 10, 2024, Trump doubled down on his pledge to punish BRICS nations with strict tariffs if they seek to move away from the US dollar as the global currency.
He originally took a particularly strong stance against China, threatening to implement 60 percent to 100 percent tariffs on Chinese imports, although these hefty tariffs would be paid by American companies and consumers purchasing Chinese products, not by China itself.
In early December 2024, Trump posted an even more direct threat to BRICS nations on Truth Social:
“We require a commitment from these countries that they will neither create a new Brics currency nor back any other currency to replace the mighty US dollar or they will face 100% tariffs and should expect to say goodbye to selling into the wonderful US economy.’
In response to Trump demanding a ‘commitment’ from BRICS nations not to challenge the supremacy of the US dollar, Kremlin spokesperson Dmitry Peskov sounded less than threatened.
‘More and more countries are switching to the use of national currencies in their trade and foreign economic activities,’ Peskov said, per Reuters. ‘If the U.S. uses force, as they say economic force, to compel countries to use the dollar it will further strengthen the trend of switching to national currencies (in international trade).’
In July 2025, President Trump took it a step further by threatening to slap an extra 10 percent in tariffs on countries who side with BRICS policies, although this has not been implemented as of November 2025. ‘Any country aligning themselves with the Anti-American policies of BRICS, will be charged an ADDITIONAL 10% tariff. There will be no exceptions to this policy,’ he wrote in a social media post.
This additional BRICS targeted tariff has not yet been implemented as of November 2025.
How will Trump’s tariffs affect BRICS nations?
If US President Donald Trump were to come through on his promise to enact 100 percent tariffs on BRICS nations the outcome could prove costly for all parties involved.
“The action would result in slower growth and higher inflation than otherwise in the US and most of the targeted economies,” according to analysis by the Peterson Institute for International Economics.
China would likely experience the worst slowing of its GDP growth as the US is its largest trading partner. One silver lining for China is that its disciplined central bank will help to save it from accelerated inflation.
While neither the 100 percent or 10 percent tariffs specifically targeting BRICS countries for their membership have been implemented, the countries still face many other tariffs from the US.
Trump’s blanket 50 percent tariffs on steel and aluminum imports, set on June 3, 2025, impact Brazil, China and the UAE. Brazil is a top three source for US steel imports, while China and the UAE are significant sources of US aluminum imports.
In late July, Brazil was also saddled with a 50 percent tariff on a broader range of goods, which US President Donald Trump inflicted on the nation in response to the trial of former President Jair Bolsonaro for his alleged coup attempt.
Trump’s tariffs could have a significant impact on Brazil’s economy, which is the largest in Latin America. However, most of the key trading sectors between the two nations are exempt from the tariff, including “civil aircraft, pig iron, precious metals, wood pulp, energy and fertilizers,” states Reuters.
India is another BRICS nation facing 50 percent tariffs. The sectors targeted span from textiles, garments and footwear to food, leather goods, gems and automobiles. Key industries such as pharmaceuticals and computer chips.
One of the major sticking points for the Trump administration is India continuing to purchase Russian oil. India and China are the two largest buyers of Russian oil, but the US has yet to punish China for purchasing oil from Russia.
Although China is the US’s biggest economic rival on the global stage, Trump hit the pause button on the escalating tariff war between the two nations until November 10, 2026.
In the meantime, the US’s 30 percent tariff on Chinese goods remains in place. Negotiations are underway, including on a proposed 245 percent tariff on Chinese electric vehicle imports.
In July, the Trump Administration imposed 30 percent tariffs on South Africa, the US’s second biggest trading partner. The African nation’s agriculture, mining and manufacturing sector are at significant risk from the tariffs, but there are exceptions in place for “copper, pharmaceuticals, semiconductors, some critical minerals, stainless steel scrap and energy products,” reports the BBC.
How are BRICS nations responding to US tariffs?
Brazilian President Luiz Inacio Lula da Silva convened an online BRICS summit on September 8, 2025, to address the threat of US trade policies and tariffs to member nations.
“Tariff blackmail is being normalized as an instrument to seize markets and interfere in domestic affairs,” stated Lula, according to a prepared statement from the Brazilian government.
“Our countries have become victims of unjustified and illegal trade practices.”
Both Lula and Jinping called upon their BRICS peers to stand together and push back against unfair trade practices, and strengthen trade and cooperation between member nations.
However, the South China Morning Post reports that summit attendees fell short of directly criticizing US President Donald Trump in a bid not to further stoke his ire. That may also be why most BRICS members are trying to negotiate with the US rather than fight back with retaliatory tariffs.
Critics have suggested Trump’s tariffs are having the undesirable effect of driving major trading partners like Brazil, India and South Africa further into the arms of US rivals China and Russia.
While currently only 9 percent of China’s exports are to other BRICS members, according to Reuters, trade between China and Russia reached a record US$244.8 billion in 2024.
In addition, China is Brazil’s largest trading partner, importing 70 percent of its soybeans from the Latin American country. In fact, 28 percent of Brazil’s total exports go to China and 24 percent of its imports are from China.
BRICS trade relations may strengthen as the bloc seeks to mitigate the economic impact of US tariffs. Or each member country may choose to do what’s in their own best interest rather than that of the group.
Take India for instance. On February 2, 2026, India broke ranks with its BRICS peers and signed a trade deal with the US in which it agreed to halt purchases of Russian oil. In exchange, the US promised to cut tariffs on a broad range of products (excluding steel and aluminum) from 50 percent down to 18 percent.
How would a new BRICS currency affect the US dollar?

RomanR / Shutterstock
For decades, the US dollar has enjoyed unparalleled dominance as the world’s leading reserve currency. According to the US Federal Reserve, between 1999 and 2019, the dollar was used in 96 percent of international trade invoicing in the Americas, 74 percent in the Asia-Pacific region and 79 percent in the rest of the world.
According to the Atlantic Council, as of November 2025 the US dollar is used in approximately 89 percent of currency exchanges, and 56 percent of all foreign currency reserves held by central banks. Due to its status as the most widely used currency for conversion and its use as a benchmark in the forex market, almost all central banks worldwide hold dollars.
Additionally, the dollar is used for the vast majority of oil trades.
Although the dollar’s reserve currency share has decreased as the euro and yen have gained popularity, the dollar is still the most widely used reserve currency, followed by the euro, the yen, the pound and the yuan.
The potential impact of a new BRICS currency on the US dollar remains uncertain, with experts debating its potential to challenge the dollar’s dominance. However, if a new BRICS currency was to stabilize against the dollar, it could weaken the power of US sanctions, leading to a further decline in the dollar’s value. It could also cause an economic crisis affecting American households. Aside from that, this new currency could accelerate the trend toward de-dollarization.
Nations worldwide are seeking alternatives to the US dollar, with examples being China and Russia trading in their own currencies, and countries like India, Kenya and Malaysia advocating for de-dollarization or signing agreements with other nations to trade in local currencies or alternative benchmarks.
While it is unclear whether a new BRICS currency would inspire the creation of other US dollar alternatives, the possibility of challenging the dollar’s dominance as a reserve currency remains.
And, as countries continue to diversify their reserve holdings, the US dollar could face increasing competition from emerging currencies, potentially altering the balance of power in global markets.
However, a study by the Atlantic Council’s GeoEconomics Center released in June 2024 shows that the US dollar is far from being dethroned as the world’s primary reserve currency. ‘The group’s ‘Dollar Dominance Monitor’ said the dollar continued to dominate foreign reserve holdings, trade invoicing, and currency transactions globally and its role as the primary global reserve currency was secure in the near and medium term,’ Reuters reported.
Warwick J. McKibbin and Marcus Noland of the Peterson Institute for International Economics agree with this sentiment, writing in their analysis of the impacts of US tariffs on BRICS nations that ‘the BRICS pose no serious threat to the dollar’s dominance.’
Dr. Shanthie Mariet D’Souza, founder and president of Mantraya Institute for Strategic Studies, sees validity in questioning the dollar’s supremacy, but views the possibility of any other currency catering its control of global finances and trade as not baked in reality.
‘Why the currency of a single country should remain the sole currency for international trade is a valid question. However, it is also true that the protraction of dollar-led international financial system has given the currency a set of decisive advantages, unlikely to be paralleled by any other currency,’ she stated in a November 2025 op-ed for the Lowy Institute.
Ultimately, the impact of a new BRICS currency on the US dollar will depend on its adoption, its perceived stability and the extent to which it can offer a viable alternative to the dollar’s longstanding hegemony.
Will the BRICS have a digital currency?
BRICS nations do not as of yet have their own specific digital currency, but a BRICS blockchain-based payment system is in the works, according to Kremlin aide Yury Ushakov in March 2024.
Known as the BRICS Bridge multi-sided payment platform, it would connect member states’ financial systems using payment gateways for settlements in central bank digital currencies. The planned system would serve as an alternative to the current international cross-border payment platform, the SWIFT system, which is dominated by US dollars.
“We believe that creating an independent BRICS payment system is an important goal for the future, which would be based on state-of-the-art tools such as digital technologies and blockchain,’ Ushakov said in an interview with Russian news agency TASS, emphasizing that it should be convenient, as well as cost effective and free of politics.
While development is underway, it has been a slow go and implementation isn’t likely before the end of the decade.
In January 2026, the Reserve Bank of India proposed linking the Central Bank Digital Currencies of member nations. An ‘interoperability’ plan is set for the 2026 BRICS Summit agenda in India.
Another dollar-alternative digital currency cross-border payment system in the works is Project mBridge, which is under development via a collaboration between the Hong Kong Monetary Authority, the Bank of Thailand, the Digital Currency Institute of the People’s Bank of China and the Central Bank of the UAE. Saudi Arabia joined the project in 2024.
The central bank digital currencies traded on the platform would be backed by gold and local currencies minted in member nations.
In June 2024, Forbes reported that the mBridge platform had reached a significant milestone by completing its minimal viable product stage (MVP).
‘The MVP platform can undertake real-value transactions (subject to jurisdictional preparedness) and is compatible with the Ethereum Virtual Machine (EVM), a decentralized virtual environment that executes code consistently and securely across all Ethereum nodes,’ the publication stated. ‘MVP thus is suitable as a testbed for new use cases and interoperability with other platforms.’
As of November 2025, the Project mBridge platform had reportedly processed 4,047 transactions worth US$55.49 billion. That’s compared to the 160 transactions worth US$22 million that were processed by October 2022.
How does the BRICS Unit relate to Project mBridge?
Watch the full interview with Andy Schectman.
‘(New Development Bank President Dilma Rousseff) came out and publicly said that there has been an agreement in principle to use a new settlement currency called the Unit, which will be backed 40 percent by gold and 60 percent by the local currencies in the BRICS union — the BRICS+ countries. That gold will be in the form of kilo bars and will be deliverable or redeemable for those entities,’ Schectman said.
‘The basket of gold and the basket of currencies will be minted in the member countries … it will be put into an escrow account, taken off the ledger so to speak — off of their balance sheet and put onto the mBridge ledger, and held in an escrow account in their own borders. It doesn’t need to be sent to a central authority.’
More recently, on a panel at the 2026 Vancouver Resource Investment Conference (VRIC), Schectman spoke about mBridge and other ex-dollar digital currency systems being explored by BRICS nations.
‘MBridge is now operational, and so is ZIPS, the cross border payment system, both of which are free from Swift intervention, and both of which are using gold through . . . the expansion of the Shanghai Gold Exchange,’ he said.
Schectman added that mBridge partners have expanded into the key Association of Southeast Asian Nations, home to hundreds of millions of people. ‘You’re adding all of these countries, and as you add all of these countries that have the ability to use their own monetary ecosystem, their own local currencies . . . chipping away at the dollar hegemony.’
He also noted that Russian Minister of Foreign Sergey Lavrov had said Russia is expanding not only the BRICS payment system, but mBridge, which is cross border between central banks and BRICS Pay.
According to Shectman, BRICS Pay is ‘a B2B retail like credit card . . . now being expanded into the Belt and Road Initiative, which is the largest infrastructure project in human history. It’s 75 percent of the human population. So little by little, all of these countries that used to purchase things and settle in dollars and to save excess dollars in Treasuries are slowly moving away. So, yeah, I think it has a profound effect over time.’
How would a BRICS currency impact the economy?
A potential shift toward a new BRICS currency could have significant implications for the North American economy and investors operating within it. Some of the most affected sectors and industries would include:
- Oil and gas
- Banking and finance
- Commodities
- International trade
- Technology
- Tourism and travel
- The foreign exchange market
A new BRICS currency would also introduce new trading pairs, alter currency correlations and increase market volatility, requiring investors to adapt their strategies accordingly.
How can investors prepare for a new BRICS currency?
Adjusting a portfolio in response to emerging BRICS currency trends may be a challenge for investors. While it does not currently seem like a BRICS currency is on the immediate horizon, Trump’s aggressive trade tactics have pushed allies away from the US, making diversification important.
Several strategies can be adopted to capitalize on these trends and diversify your portfolio:
- Gain exposure to BRICS equity markets through stocks and ETFs that track BRICS market indexes.
- Consider alternative investments such as real estate or private equity in the BRICS countries.
Prudent investors will also weigh these strategies against their exposure to market, political and currency fluctuations.
In terms of investment vehicles, investors could consider ETFs such as the iShares MSCI BIC ETF (ARCA:BKF) or the Pacer Emerging Markets Cash Cows 100 ETF (NASDAQ:ECOW). They could also invest in mutual funds such as the T. Rowe Price Emerging Markets Equity Fund, or in individual companies within the BRICS countries.
Simply put, preparing for a new BRICS currency or potential de-dollarization requires careful research and due diligence by investors. Diversifying currency exposure, and investing in commodities, equity markets or alternative investments are possible options to consider while being mindful of the associated risks.
Investor takeaway
While it is not certain whether the creation of a BRICS reserve currency will come to pass, its emergence would pose significant implications for the global economy and potentially challenge the US dollar’s dominance as the primary reserve currency. This development would present unique investment opportunities, while introducing risks to existing investments as the shifting landscape alters monetary policy and exacerbates geopolitical tensions.
For those reasons, investors should closely monitor the progress of a possible BRICS currency. And, if the bloc does eventually create one, it will be important watch the currency’s impact on BRICS member economies and the broader global market. Staying vigilant will help investors to capitalize on growth prospects and hedge against potential risks.
FAQs for a new BRICS currency
Is a BRICS currency possible?
Some financial analysts point to the creation of the euro in 1999 as proof that a BRICS currency may be possible. However, this would require years of preparation, the establishment of a new central bank and an agreement between the five nations to phase out their own sovereign currencies; it would most likely also need the support of the International Monetary Fund to be successful internationally.
The impact of its war on Ukraine will continue to weaken Russia’s economy and the value of the ruble, and China is intent on raising the power of the yuan internationally. There is also a wide chasm of economic disparity between China and other BRICS nations. These are no small obstacles to overcome.
Would a new BRICS currency be backed by gold?
Additionally, speaking at the New Orleans Investment Conference 2023, well-known author Jim Rickards gave a detailed talk on how a gold-backed BRICS currency could work. At the time, he suggested that if a BRICS currency unit is worth 1 ounce of gold and the gold price goes to US$3,000 per ounce, the BRICS currency unit would be worth US$3,000, while the dollar would lose value compared to the BRICS currency as measured by the weight of gold.
Importantly though, he doesn’t see this as a new gold standard, or the end of the US dollar or the euro.
“(With) a real gold standard, you can take the currency and go to any one of the central banks and get some gold,” Rickards said at the event. “With BRICS they don’t have to own any gold, they don’t have to buy any gold, they don’t have to prop up the price. They can just rise on the dollar gold market.’
How much gold do the BRICS nations have?
The combined central bank gold holdings of the original BRICS nations plus Egypt (the only nation of the five new additions to have central bank gold reserves) accounts for more than 20 percent of all the gold held in the world’s central banks. Russia, India and China rank in the top 10 for central bank gold holdings.
Russia controls 2,326.42 metric tons (MT) of the yellow metal, making it the fifth largest for central bank gold reserves. China follows in the sixth spot with 2,306.3 MT of gold and India places eighth with 880.17 MT. Brazil and South Africa’s central bank gold holdings are much smaller, coming in at 172.44 MT and 125.5 MT, respectively. New BRICS member Egypt’s gold holdings are equally small, at 129.36 MT.
Securities Disclosure: I, Melissa Pistilli, hold no direct investment interest in any company mentioned in this article.
This post appeared first on investingnews.com


 Carbonxt Group (CG1:AU) has announced Carbonxt Secures $500,000 Convertible Note Funding