

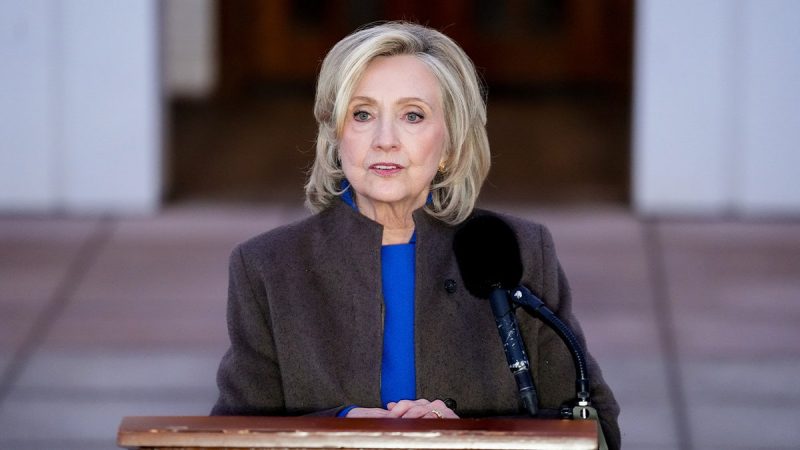
Former Secretary of State Hillary Clinton wasted no time criticizing Republicans after she emerged from a roughly six-hour grilling in the House Oversight Committee’s Jeffrey Epstein probe Thursday evening.
Clinton told reporters she answered questions ‘repetitively, literally over and over again’ after blasting Republicans for holding a closed-door deposition instead of a public hearing.
She said, however, that she would not testify again if there was a public hearing, telling reporters, ‘They had a chance to do it in public, and I wish they had done it in public. And I think they’re making the wrong decision, avoiding doing it in public.
‘It then got, at the end, quite unusual because I started being asked about UFOs and a series of questions about Pizzagate, one of the most vile, bogus conspiracy theories that was propagated on the internet that was serving as the basis of a member’s questions to me,’ Clinton said.
She also knocked Republican lawmakers for not attending the deposition of former Victoria’s Secret CEO Leslie Wexner in person.
Clinton did save praise for House Oversight Committee Chairman James Comer, R-Ky., however, ‘for raising a series of significant questions that I responded to about the nature of the investigation and the areas that I thought should be explored.’
‘So, I appreciated that. I want to see the truth come out. So, that was a reassuring way to end a very long, repetitive, deposition,’ Clinton said.
She also reiterated comments from her opening statement that she did not know Epstein and said she only knew Ghislaine Maxwell ‘as an acquaintance.’
When asked why Maxwell was invited to daughter Chelsea Clinton’s wedding, however, Clinton said she was a ‘plus-one of someone invited.’
Clinton’s deposition began in the 11 a.m. hour and wrapped in the 5 p.m. hour in her hometown of Chappaqua, New York.
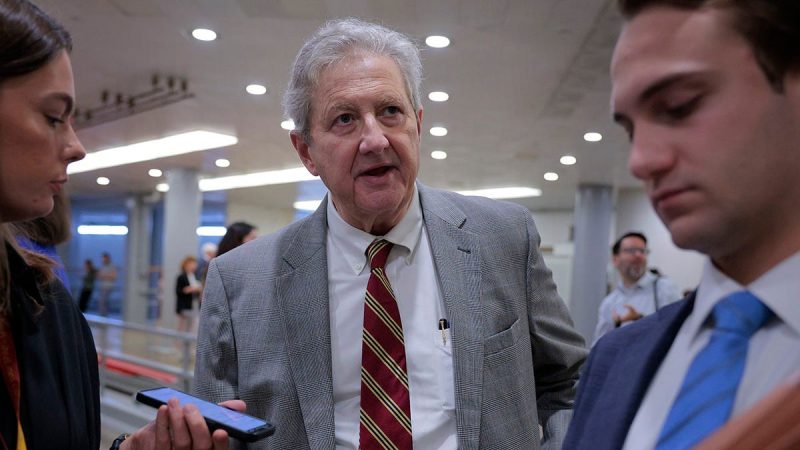
Comer said afterward that Clinton ‘answered most of our questions’ in a ‘productive’ deposition but said Republicans ultimately ‘weren’t satisfied’ with what they gleaned.
‘The number of times that she said, ‘I don’t know, you’ll have to ask my husband,’ was more than a dozen,’ Comer said.
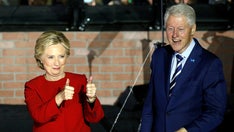
Former President Bill Clinton is slated to testify behind closed doors Friday for what Comer said would be an ‘even longer’ deposition.
Neither Clinton is implicated in any wrongdoing related to Epstein or Maxwell, but Bill Clinton was known to have a relationship with the late financier and sex trafficker before the federal investigations into Epstein’s crimes came to light.
Hillary Clinton said that relationship ‘ended years, several years, before anything about Epstein’s criminal activities came to light.’
Rep. William Timmons, R-S.C., told Fox News Digital it was ‘frustrating’ to see Hillary Clinton ‘obstinate and sort of annoyed at the process.’
‘She had an excuse for everything. But when you’ve got a pattern of involvement and a pattern of association, the American people deserve answers,’ Timmons said.
‘Honestly, I tend to find her to be fairly credible, but I mean, all of this is going to culminate tomorrow with President Clinton, and he has a lot of really hard questions to answer. And I don’t think that the American people are going to like his answers.’
The deposition was tense at times, a tension Clinton alluded to when she accused Republicans of breaking the rules when Rep. Lauren Boebert, R-Colo., apparently shared a photo from inside the deposition room with a right-wing influencer.
‘We had a bit of a challenge in the beginning because we agreed upon rules based on the fact it was going to be a closed hearing at their demand. And one of the members violated that rule, which was very upsetting because it suggested that they might violate other of our agreements,’ Clinton said.
‘So, we had to cease the hearing for a period of time until we could get assurances that no rules would be broken going forward.’
It’s notable, however, that Democrats also leaked information from inside the room but did not get any public blowback. A New York Times reporter posted reporting about the deposition on X earlier in the day while citing a ‘Dem member in the room.’
Bill Clinton’s deposition is also expected to kick off in the 11 a.m. hour on Friday at the Chappaqua Performing Arts Center.
Related Article


 Metro Mining (MMI:AU) has announced 2025 Financial Results

 Zeus Resources Limited (ZEU:AU) has announced Pause in Trading


 Basin Energy (BSN:AU) has announced Definitive agreement for the sale of the Marshall project


 Uranium American Resources Inc. is a mining company. The Company maintains mining leases on properties in Nevada. The Company is engaged in mining activities in the mineable resource of gold and silver remains in the Comstock Mining District. Its Comstock project is located in northwestern Nevada, approximately 40 kilometers southeast of Reno. The Company has three mineralized structures: The Comstock Lode, The Occidental/Brunswick Lode and The Silver City Spur. The Comstock Lode is an epithermal gold and silver deposit in a large fault system at the eastern base of the Virginia Range. The Occidental/Brunswick Lode is a gold and silver mineralized epithermal system in approximately 1.5 kilometers east of the main Comstock Lode and running parallel to it. The Silver City Spur is a branch of the Comstock Lode that runs southeast and connects with the southwestern splays of the Occidental Lode.