After-Tax NPV(8%) of $473M and IRR of 49% at USD $1,000/mtu WO3; Fully funded 20,000m Drill Program Underway to Expand Scale of the Borralha Project
Key Highlights:
-
Robust Economics: After-tax NPV(8%)1 of $473.4 million (USD $346.6 million) and IRR2 of 48.8% at USD $1,000/mtu WO₃3.
-
Capital Efficient Development: Initial capital4 of approximately $124.2 million (USD $91 million) with 4.2-year payback5.
-
Strong Base Case: After-tax IRR2 of 27.2% and NPV(8%)1 of $182.7 million (USD $134.0 million) at ~USD $704/mtu WO₃ (Argus long-term forecast).
-
Significant Upside Leverage: After-tax IRR2 of 78.4% and NPV(8%)1 of $963.8 million (USD $706.4 million) at USD $1,500/mtu WO₃.
-
Resource Growth Just Beginning: Fully funded 20,000-metre drill program underway at the Borralha Project targeting resource expansion and potential mine life extension well beyond the initial 11-year mine plan.
All amounts in Canadian dollars unless stated otherwise.
Vancouver, British Columbia–(Newsfile Corp. – March 2, 2026) – Allied Critical Metals Inc. (CSE: ACM,OTC:ACMIF) (OTCQB: ACMIF) (FSE: 0VJ0) (‘Allied‘ or the ‘Company‘) is pleased to announce the results of its initial Preliminary Economic Assessment (‘PEA‘) for its 100%-owned Borralha Tungsten Project (‘Borralha‘ or the ‘Project‘) in northern Portugal.
‘The completion of the PEA marks another important milestone for the Company. In addition to the significant tailwinds provided by the significant increase in the price of tungsten, which has surged to more than USD $1,900/mtu [Source: Fastmarkets], we are very pleased to see have been able to receive support from idD Portugal Defence, the Portuguese public entity overseeing the nation’s Defence Industry, which has endorsed the Borralha Project as a strategic initiative of national importance. We have also received a favourable Environmental Impact Declaration, subject to standard regulatory conditions (Declaração de Impacte Ambiental Favorável Condicionada – ‘DIA’) from the Portuguese Environment Agency (Agência Portuguesa do Ambiente, I.P. – APA),’ commented Roy Bonnell, CEO and Director of Allied. ‘We could not be more pleased with the considerable advancement of the Borralha Project and look forward to continuing to more progress at the Borralha Project and the Vila Verde Project, which are both strategic critical mineral tungsten assets well positioned within the EU.’
The PEA outlines a technically robust and capital-efficient underground tungsten development project within the European Union, delivering strong economics across a range of pricing assumptions. Importantly, the study reflects only the Santa Helena Breccia deposit and an initial 11-year mine plan. The Company is committed to long term expansion of the current resource estimate and as such has recently commenced a fully funded 20,000-metre drill program designed to expand the current resource and enhance long-term project scale.
Initial PEA Economic Summary (After-Tax) for the Borralha Project
| Medium Case – USD $1,000/mtu WO₃ |
| NPV(8%)1 |
IRR2 |
Payback3 |
| $473.4 million4 |
48.8% |
4.2 years |
| (USD$ 346.6 million) |
|
|
| Base Case – Argus Long-Term Forecast (US$677 to $763/mtu WO₃; ~USD $704/mtu WO₃ Average) |
| NPV(8%)1 |
IRR2 |
Payback3 |
| $182.7 million4 |
27.2% |
5.8 years |
| (USD$ 134.0 million) |
|
|
| High Case – USD $1,500/mtu WO₃ |
| NPV(8%)1 |
IRR2 |
Payback3 |
| $963.8 million4 |
78.4% |
3.2 years |
| (USD$ 706.4 million) |
|
|
Notes:
1. NPV is a Non-GAAP measure; see notes below for additional information regarding NPV.
2. IRR is a Non-GAAP measure; see notes below for additional information regarding IRR.
3. Payback is a Non-GAAP measure. see notes below for additional information regarding payback.
4. Canadian dollar (CAD) equivalents calculated used a foreign exchange rate of CAD $1.3658/USD.
Mine design and cut-off grade selection were developed using a conservative USD $659/mtu WO₃ assumption. Recent reported tungsten market prices have reached approximately USD $1,998/mtu [Source: Fastmarkets; February 27, 2026], demonstrating meaningful leverage to current market conditions.
Initial Mine Plan – Strong Base with Expansion Potential
-
Mine life: 11 years
-
Average annual production: ~1,708 tonnes WO₃
-
Peak annual production: 2,388 tonnes WO₃
-
Processing rate: 1.4 million tonnes per annum
-
Average mill feed grade: 0.20% WO₃
-
All-in sustaining cost (AISC)6 estimate: ~USD $303/mtu WO₃ (CAD $413.84/mtu WO₃)
The PEA mine plan incorporates Measured, Indicated and Inferred Mineral Resources from the Santa Helena Breccia deposit. Mineralization remains open along strike and at depth.
The ongoing 20,000-metre drill program is targeting:
-
Expansion of the current 13.0 Mt Measured & Indicated resource
-
Conversion of Inferred resources into higher-confidence categories
-
Potential extension of mine life beyond 11 years
-
Evaluation of throughput optimization and scale growth
The Company views this initial PEA as a foundational step in what is expected to be a multi-stage growth strategy at the Borralha Project.
Roy Bonnell, CEO & Director commented, ‘This initial PEA confirms the Borralha Project as a high-return, capital-efficient tungsten development project in a Tier-1 European jurisdiction. At USD $1,000 per mtu (significantly below current reported market pricing) the Borralha Project generates a 48.8% after-tax IRR with modest initial capital of approximately USD $91 million.
Importantly, this PEA reflects only the Santa Helena Breccia and an initial 11-year mine plan. With future exploration work and the 20,000 meters of drilling currently underway, we are focused on expanding resources, extending mine life and enhancing overall project scale. We believe we are at the beginning of unlocking the Borralha Project’s full potential.
Combined with a favourable Environmental Impact Declaration, we believe that this PEA opens the door to project level financing for both our industrial scale plant and our pilot plant at the Vila Verde Project.’
Introduction
This initial PEA contemplates development of an underground mining operation at the Santa Helena Breccia deposit within Borralha with a nominal processing capacity of 1.4 million tonnes per annum, utilizing conventional crushing, grinding and gravity concentration to produce a saleable Wolframite concentrate grading approximately 65% WO₃.
The Borralha Project has received a favourable Environmental Impact Declaration (‘DIA’), materially advancing permitting and reducing development risk relative to many global tungsten projects.
Economic Summary
This initial PEA was developed using three pricing frameworks: (i) Low/Base Case: Argus long-term forecast (variable annually) averaging approx. USD $704 per mtu WO₃; (ii) USD $1,000 per mtu WO₃; and (iii) USD $1,500 per mtu WO₃.
Mine design and cut-off grade selection were developed using a conservative price assumption of USD $659 per mtu WO₃.
Table 1 — Economic Results (After-Tax)
| Scenario |
Price1 |
NPV (8%)2 |
IRR3 |
Payback4 |
| Medium |
$1,365/mtu
(USD $1,000/mtu) |
$473.4M
(USD $346.6M) |
48.8% |
4.2 years |
| Base |
$962/mtu
(USD $704/mtu) |
$182.7M
(USD $134.0M) |
27.2% |
5.8 years |
| High |
$2,049/mtu
(USD $1,500/mtu) |
$963.8M
(USD $706.4M) |
78.4% |
3.2 years |
Notes:
1. Prices based on Argus Media Group price forecasts. Canadian dollar (CAD) equivalents calculated used a foreign exchange rate of CAD $1.3658/USD.
2. NPV is a Non-GAAP measure; see notes below for additional information regarding NPV. M = million.
3. IRR is a Non-GAAP measure; see notes below for additional information regarding IRR.
4. Payback is a Non-GAAP measure. see notes below for additional information regarding payback.
The results highlight significant sensitivity to tungsten price while maintaining positive economics under conservative long-term assumptions.
For reference, current reported tungsten market prices are materially above the $1,365 per mtu (USD $1,000 per mtu) sensitivity case presented herein, reaching recently $2,729 per mtu (USD $1,998 per mtu) as at February 27, 2026 [Source: Fastmarkets.]
1. Project Overview
The Borralha Tungsten Project is located in the parish of Salto, municipality of Montalegre, district of Vila Real, Portugal. The project comprises a continuous exploitation concession area of approximately 382.48 hectares (3.82 km²).
This initial PEA has been prepared in accordance with National Instrument 43-101 – Standards of Disclosure for Mineral Projects (‘NI 43-101‘) and is based on the updated Mineral Resource Estimate for the Santa Helena Breccia, effective December 30, 2025. See Company’s current technical report on Borralha (the ‘Technical Report‘) entitled ‘Technical Report on the Borralha Property, Parish of Salto, District of Vila Real, Portugal’, dated effective December 30, 2025, which is published on the Company’s website at www.alliedcritical.com and under its profile on SEDAR+ at www.sedarplus.ca.
Borralha represents one of the largest undeveloped tungsten resources within the European Union and benefits from gravity-dominant processing, reducing metallurgical risk relative to flotation-dependent systems. The project aligns with European critical raw material supply objectives.
2. Mineral Resource Estimate
This initial PEA is based on the updated Mineral Resource Estimate (‘MRE‘ or ‘2025 MRE‘) for the Santa Helena Breccia, which were presented in accordance with NI 43-101 in the Company’s current Technical Report.
Mineral Resources are reported in situ and undiluted and do not incorporate modifying factors such as mining dilution, mining recovery, metallurgical recovery, capital costs, operating costs, or economic analysis. Mineral Resources are not Mineral Reserves and do not have demonstrated economic viability.
MRE Cut-off Grade: 0.09% WO₃
The cut-off grade was selected based on reasonable prospects for eventual economic extraction under conceptual underground mining and gravity-dominant processing assumptions, including a very conservative tungsten price of USD$ 550/mtu WO₃ and assumed recovery of approximately 80% (for MRE cut-off determination only). The 2025 MRE reflects a material increase in tonnage and geological confidence relative to the previous mineral resource estimate published in March 2024.
Under the 2025 MRE, the Santa Helena Breccia has been tested by 41 drill holes and surface trenching over approximately 400 meters of strike length and to depths exceeding 350 meters below surface. Mineralization remains open along strike and at depth.
Table 2 — 2025 MRE for Borralha (see also Technical Report for further details)
| Classification |
Tonnes (Mt) |
Grade (% WO3) |
| Measured + Indicated |
13.0 |
0.21 |
| Inferred |
7.7 |
0.18 |
3. Mining Method and Production Plan
3.1 Selected Mining Method
The planned mining method for the Santa Helena Breccia involves using mostly long-hole open stoping with cemented paste backfill. This method was selected based on: (i) steeply dipping geometry of the breccia-hosted mineralization; (ii) demonstrated geological continuity; (iii) favorable rock mass conditions; (iv) productivity and operating cost advantages; and (v) reduced surface footprint.
Drift-and-fill mining is incorporated locally in narrower high-grade zones to enhance resource recovery. Open-pit mining and alternative underground methods were evaluated during the conceptual study stage and were not selected due to environmental constraints, scale suitability, and relative operating efficiency.
3.2 Mine Production Schedule
Key operating parameters:
- Nominal processing rate: 1.4 million tonnes per annum
- Estimated mine life: approximately 11 years
- Total life-of-mine processed tonnes: approximately 13.4 million tonnes
- Average life-of-mine mill feed grade: approximately 0.20% WO₃
The production schedule supports consistent mill feed and stable concentrate production throughout the mine life.
Table 3 — LoM Totals and Averages
| Item |
Amount |
| Mine life (production years shown) |
11 years (2028–2039) |
| Total ore processed |
13,436,040 t |
| Weighted average WO₃ grade |
0.203% WO₃ (≈0.20%) |
| Total contained WO₃ |
27,332 t |
| Total recovered WO₃ @ 75% |
20,499 t |
| Average annual recovered WO₃ @ 75% |
~1,708 t/y |
Table 4 — Life-of-Mine Schedule Summary
| Year |
Ore Processed (t) |
Avg. WO₃ Grade (%) |
Recovered WO₃ (t) |
| 2028 |
876,304 |
0.19 |
1,249 |
| 2029 |
988,042 |
0.20 |
1,482 |
| 2030 |
1,387,624 |
0.18 |
1,873 |
| 2031 |
1,339,273 |
0.19 |
1,908 |
| 2032 |
1,362,177 |
0.18 |
1,839 |
| 2033 |
1,373,856 |
0.23 |
2,370 |
| 2034 |
1,444,646 |
0.21 |
2,275 |
| 2035 |
1,447,061 |
0.22 |
2,388 |
| 2036 |
1,236,886 |
0.20 |
1,855 |
| 2037 |
1,226,553 |
0.20 |
1,840 |
| 2038 |
585,701 |
0.26 |
1,142 |
| 2039 |
167,917 |
0.22 |
277 |
3.3 Dilution and Recovery Assumptions
The mine plan incorporates Measured, Indicated, and Inferred Mineral Resources within a stope optimization framework consistent with long-hole open stoping methods.
Applied modifying factors include:
- Mining dilution: approximately 8% (average between primary and secondary stopes)
- Mining recovery: approximately 89%
- ~90% for primary stopes
- ~88% for secondary stopes
- Drift-and-fill: approximately 7.5% dilution and 95% recovery
After application of these factors, the projected average life-of-mine mill feed grade is approximately 0.20% WO₃.
The PEA includes Inferred Mineral Resources that are considered too speculative geologically to have economic considerations applied that would enable them to be categorized as Mineral Reserves. There is no certainty that the results of the PEA will be realized.
Inferred material represents less than approximately 40% of the life-of-mine stope inventory on a volumetric basis and is predominantly located along the margins and outer extents of the deposit.
4. Metallurgy and Processing
4.1 Metallurgical Test Work
Metallurgical test work completed to date indicates that Santa Helena Breccia mineralization is amenable to gravity-dominant processing.
The initial metallurgical program (2023–2024) evaluated crushing, grinding, sulfide flotation, gravimetric concentration, and magnetic separation. Subsequent optimization reduced reliance on flotation by incorporating dense media separation (‘DMS‘) pre-concentration and enhanced gravity recovery.
4.2 Process Flow Sheet
The proposed process plant includes:
- Three-stage crushing to approximately 6 mm
- DMS pre-concentration on the 6–2 mm fraction (rejecting approximately 40% of mass)
- Grinding of DMS product and -2 mm fraction to 1 mm
- Gravimetric concentration using spirals and shaking tables
- Magnetic and electrostatic separation for final concentrate upgrading
- Flotation circuit for copper and tin recovery
- Filtered tailings with dewatering and partial paste backfill return underground
4.3 Recovery and Concentrate Grades
Preliminary metallurgical recovery estimates:
- Tungsten: 75%
- Copper: ~60%
- Tin: 30%
Expected concentrate specifications:
- Tungsten concentrate: ~65% WO₃
- Copper concentrate: ~21% Cu
- Tin concentrate: ~50% Sn
Silver credits may partially report to the copper concentrate, subject to further test work confirmation.
5. Infrastructure and Site Requirements
The Borralha Project benefits from:
- Regional road access
- Grid power availability
- Underground mining configuration minimizing surface disturbance
- Filtered dry-stack tailings concept
- Closed-loop water management system
6. Environmental and Permitting
In January 2026, the Portuguese Environment Agency issued a Favourable Environmental Impact Declaration (‘DIA‘) for the Borralha Project, subject to standard regulatory conditions.
This milestone confirms environmental acceptability of the proposed development and enables progression to the RECAPE stage and subsequent construction permitting.
The Borralha Project aligns with European Union critical raw material strategy and contributes to regional economic development objectives.
7. Economic Framework
7.1 Pricing Framework
The life-of-mine design, cut-off grade selection and production schedule were developed using a conservative tungsten price assumption of USD $659 per metric tonne unit (‘mtu‘) WO₃, consistent with the Argus long-term base case forecast. The Base Case economic model applies the Argus high-case long-term forecast on a year-by-year basis, ranging from approximately USD $763 per mtu in 2028 and gradually declining toward approximately USD $677 per mtu by 2040, for an average price of approximately USD $704 per mtu. [Source: Argus Media Group.]
This approach maintains a conservative technical design basis while allowing the economic analysis to reflect updated long-term market expectations without re-optimizing mine geometry.
Flat price sensitivity scenarios at USD $1,000/mtu and USD $1,500/mtu WO₃ are presented for comparative purposes.
7.2 Operating Cost Summary
The Borralha Project is based on conventional underground mining and gravity-dominant processing, resulting in a competitive cost structure.
Life-of-mine average operating costs7 are estimated at:
- US$49 per tonne processed
- Equivalent to approximately USD $245 per mtu WO₃ produced (based on a 0.20% average mill feed grade and 75% metallurgical recovery)
Operating cost components include:
- Underground mining
- Processing and plant operations
- General and administrative costs
- Site services and infrastructure support
The cost structure incorporates modifying factors of approximately 8% mining dilution, 89% mining recovery, and 75% metallurgical recovery.
7.3 All-In Sustaining Cost (AISC)
The Project’s estimated all-in sustaining cost8, inclusive of sustaining capital and site-level costs, is approximately: USD $303 per mtu WO₃.
This positions the Borralha Project competitively within the global tungsten cost curve.
7.4 Capital Costs
The PEA estimates capital costs9 as follows:
- Initial capital cost: approximately USD $91 million (CAD $124.3 million)
- Sustaining capital: approximately USD $87 million (CAD $118.8 million)
- Total life-of-mine capital: approximately USD $178 million (CAD $243.1 million)
Capital estimates are preliminary in nature and carry an accuracy range of ±35%, consistent with PEA-level studies.
7.5 Economic Metrics (After-Tax)
| Medium Case – USD $1,000/mtu WO₃ |
| NPV(8%)1 |
IRR2 |
Payback3 |
| $473.4 million |
48.8% |
4.2 years |
| (USD$ 346.6 million) |
|
|
| Base Case – Argus Long-Term Forecast (US$677 to $763/mtu WO₃; ~USD $704/mtu WO₃ Average) |
| NPV(8%)1 |
IRR2 |
Payback3 |
| $182.7 million |
27.2% |
5.8 years |
| (USD$ 134.0 million) |
|
|
| High Case – USD $1,500/mtu WO₃ |
| NPV(8%)1 |
IRR2 |
Payback3 |
| $963.8 million |
78.4% |
3.2 years |
| (USD$ 706.4 million) |
|
|
Notes:
1. NPV is a Non-GAAP measure; see notes below for additional information regarding NPV.
2. IRR is a Non-GAAP measure; see notes below for additional information regarding IRR.
3. Payback is a Non-GAAP measure. see notes below for additional information regarding payback.
4. Canadian dollar (CAD) equivalents calculated used a foreign exchange rate of CAD $1.3658/USD.
Mine design and cut-off grade selection were developed using a conservative USD $659/mtu WO₃ assumption. Recent reported tungsten market prices have reached approximately USD $1,998/mtu [Source: Fastmarkets; February 27, 2026], demonstrating meaningful leverage to current market conditions.
7.6 Sensitivity Analysis
Sensitivity analysis demonstrates that Project economics are most sensitive to: (i) tungsten price; (ii) capital costs; (iii) operating costs; and (iv) metallurgical recovery.
The Project retains positive economics across a range of tungsten price assumptions. At the Base Case price assumption, the Project generates robust operating margins, with significant leverage to higher tungsten price scenarios.
The Project demonstrates strong leverage to tungsten price. The following sensitivity analysis illustrates the post-tax IRR and NPV (8%) across a flat tungsten price range of USD $500 to USD $1,700 per mtu WO₃.
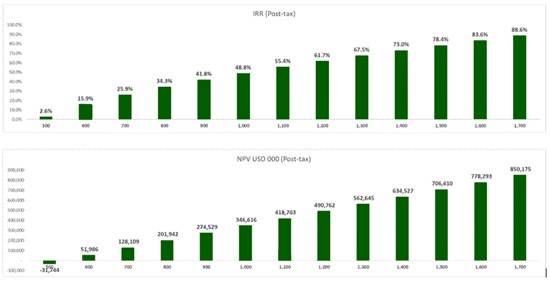
Figure 1 — After-Tax NPV (8%) and IRR Sensitivity to Tungsten Price
To view an enhanced version of this graphic, please visit:
https://images.newsfilecorp.com/files/11632/285820_ede9ceca64ea6a8e_001full.jpg
Notes: IRR is a Non-GAAP measure; see notes below for additional information regarding IRR. NPV is a Non-GAAP measure; see notes below for additional information regarding NPV.
8. Growth and Expansion Opportunities
Mineralization at the Santa Helena Breccia remains open along strike and at depth, providing potential for future Mineral Resource expansion through additional drilling. The current underground mine design is based on the defined Mineral Resource; however, further infill and step-out drilling may support resource conversion and potential extension of mine life. The process plant has been designed at a nominal throughput of 1.4 Mtpa. Subject to further engineering studies and market conditions, the plant layout may allow for future throughput expansion. Selective mining and continued geological refinement may enhance grade control and support optimization of the life-of-mine grade profile.
9. Strategic Positioning
The Borralha Project represents one of the largest undeveloped tungsten resources within the European Union and is positioned to contribute to European supply chain security for this designated critical raw material. The combination of underground mining, gravity-dominant processing and significant permitting advancement materially reduces technical and development risk relative to many global tungsten development projects.
The favourable Environmental Impact Declaration (DIA) provides regulatory clarity and supports advancement toward the next stage of engineering and feasibility.
10. Project Risks and Uncertainties
This initial PEA is preliminary in nature and includes Inferred Mineral Resources that are considered too speculative geologically to have economic considerations applied that would enable them to be categorized as Mineral Reserves. There is no certainty that the results of the PEA will be realized.
Key risks and uncertainties include:
- Inclusion of Inferred Mineral Resources within the mine plan
- Variability in tungsten price and foreign exchange rates
- Capital cost escalation and schedule risk
- Metallurgical recovery variability
- Underground geotechnical and hydrogeological conditions
- Regulatory and permitting timelines
- Availability of equipment and human resources
11. Recommended Work Program
The Company intends to advance Borralha toward the next stage of engineering through:
- Infill drilling to upgrade Inferred Mineral Resources to higher confidence categories
- Step-out drilling to expand Mineral Resources and potentially extend mine life.
- Additional metallurgical optimization and variability testing
- Detailed geotechnical and hydrogeological investigations
- Engineering advancement toward a Pre-Feasibility Study
- Ongoing permitting and RECAPE progression
These activities are intended to further de-risk the Borralha Project and support advancement toward a Feasibility Study.
12. Quality Control
The Company has implemented a comprehensive and well-documented quality assurance and quality control (‘QA/QC‘) program consistent with industry best practices. Drill core and reverse circulation samples were prepared at ISO-accredited ALS Global facilities in Seville, Spain, and analyzed at ALS Global’s certified laboratory in Loughrea, Ireland, using XRF methods for tungsten (W-XRF05 and W-XRF10), with routine internal laboratory QA/QC procedures including pulp duplicates. The Company inserted certified reference materials (‘CRMs‘), blank samples, and field duplicates into the sample stream at regular intervals, including one CRM every 20 routine samples and two blanks per analytical batch.
Five independent CRMs covering multiple grade ranges were used. Samples exceeding ±3 standard deviations from expected CRM values, or blanks exceeding three times detection limits, triggered re-assay of the affected batch. Reverse circulation samples were weighed to monitor recovery and reject materials were securely stored. Independent verification sampling by a Qualified Person confirmed the reliability of the analytical database. The Qualified Persons are satisfied that the QA/QC procedures and resulting analytical data are appropriate for use in the Mineral Resource Estimate and the PEA.
13. Qualified Persons
The scientific and technical information contained in this news release has been reviewed and approved by the following Qualified Persons, as defined under NI 43-101:
J. Douglas Blanchflower, P.Geo.
Mr. Blanchflower is an independent Qualified Person under NI 43-101 and was retained by Allied Critical Metals Inc. to prepare the NI 43-101 Technical Report dated effective December 30, 2025. He has overall responsibility for the 2025 MRE and the Technical Report. Mr. Blanchflower is a Registered Professional Geoscientist in good standing with the Association of Professional Engineers and Geoscientists of British Columbia (No. 19086) and has more than five decades of experience in mineral exploration, resource estimation, and technical reporting. Mr. Blanchflower has reviewed and approved the scientific and technical information in this news release relating to the mineral resource estimate.
David Castro López, BSc, MIMMM, QMR
Mr. Castro López is a Mining Engineer and a Professional Member (MIMMM #685484) and Qualified for Minerals Reporting (QMR) of the Institute of Materials, Minerals and Mining (IOM3). He is independent of the Company and the Borralha Project. Mr. Castro López contributed to the metallurgical review and process design considerations supporting the PEA and takes responsibility for the metallurgical and mineral processing information contained herein. Mr. López has reviewed and approved the scientific and technical information in this news release relating to the metallurgical and mineral processing information contained herein.
Miguel Cabal, EurGeol, Licensed Geologist
Mr. Cabal is a licensed geologist with the European Federation of Geologists (EuroGeol #1439) with over 28 years of experience in mineral exploration, resource evaluation and mine development. He is Managing Director of Geomates (Spain) and has contributed to multiple NI 43-101 and JORC-compliant technical reports, including PEA, PFS and feasibility studies. Mr. Cabal is independent of Allied Critical Metals Inc. and the Borralha Project and has reviewed and approved the mining and economic components of the PEA. Mr. Cabal has reviewed and approved the scientific and technical information in this news release relating to the mining and economic components of this news release.
Vítor Arezes, BSc, MIMMM, QMR
Mr. Arezes is Vice President Exploration of Allied Critical Metals Inc. and a Qualified Person under NI 43-101. He is not independent of the Company due to his role as an officer. Mr. Arezes has extensive experience in tungsten and polymetallic mineral systems and has conducted multiple site visits to the Borralha Project, including during the 2025 drilling campaign. He contributed to geological interpretation, exploration oversight, and technical review supporting the PEA. He is a member of the Institute of Materials, Minerals and Mining (MIMMM #703197) and a Qualified Mineral Resources and Ore Reserves Professional (QMR), and by reason of education, professional experience, and accreditation, meets the definition of a Qualified Person as defined in NI 43-101. Mr. Arezes has reviewed and approved all of the scientific and technical information in this news release.
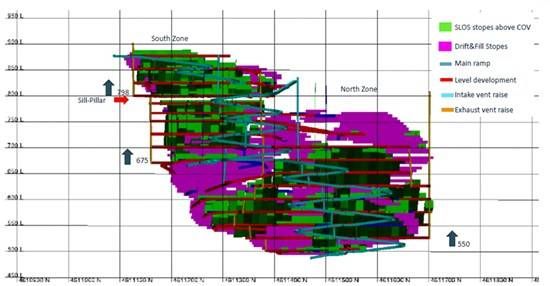
Figure 2 — South – North longitudinal section on mine design at Sta. Helena Breccia
To view an enhanced version of this graphic, please visit:
https://images.newsfilecorp.com/files/11632/285820_ede9ceca64ea6a8e_002full.jpg
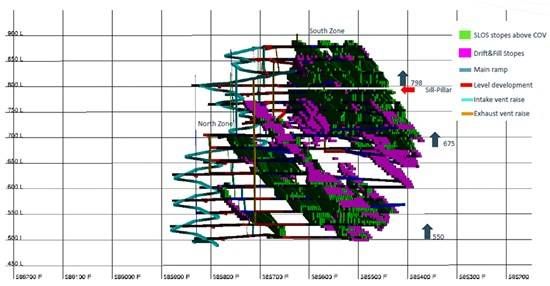
Figure 3 — East – West transversal section on mine design at Sta. Helena Breccia
To view an enhanced version of this graphic, please visit:
https://images.newsfilecorp.com/files/11632/285820_ede9ceca64ea6a8e_003full.jpg
About Allied Critical Metals Inc.
Allied Critical Metals Inc. is a Canadian-based mining company focused on the advancement and revitalization of its 100%-owned Borralha Tungsten Project and the Vila Verde Tungsten Project in northern Portugal.
The Borralha Project is one of the largest undeveloped tungsten resources within the European Union and benefits from a favourable Environmental Impact Declaration (DIA), positioning the Project for advancement toward feasibility and development. Vila Verde represents additional exploration upside within the same strategic jurisdiction.
Tungsten has been designated a critical raw material by the United States and the European Union due to its strategic importance in defense, aerospace, manufacturing, automotive, electronics and energy applications. Currently, China, Russia and North Korea account for approximately 87% of global tungsten supply and reserves, highlighting the importance of secure western sources.
Further details regarding the Borralha Project are available in the Company’s NI 43-101 Technical Report dated December 30, 2025, filed on SEDAR+ at www.sedarplus.ca and on the Company’s website at www.alliedcritical.com.
ON BEHALF OF THE BOARD OF DIRECTORS
‘Roy Bonnell’
CEO and Director
Additional information is also available by contacting the Company:
Dave Burwell
Vice President, Corporate Development
daveb@alliedcritical.com
Tel:403-410-7907
Toll Free: 1-800-221-0915
Please also visit our website at www.alliedcritical.com.
Also visit us at:
LinkedIn: https://www.linkedin.com/company/allied-critical-metals-inc/
X: https://x.com/@alliedcritical/
Facebook: https://www.facebook.com/alliedcriticalmetals/
Instagram: https://www.instagram.com/alliedcriticalmetals/
The Canadian Securities Exchange does not accept responsibility for the adequacy or accuracy of this release.
Cautionary Statement Regarding Forward-Looking Information
This news release contains ‘forward-looking information’ within the meaning of applicable Canadian securities laws (‘FLI‘). FLI in this release includes, without limitation, statements regarding: (A) the PEA results and economic indicators (e.g., NPV, IRR, payback and related sensitivities); (B) the conceptual mine plan and operating framework (mining approach, processing rates, production profiles, cost ranges and schedules); (C) the technical basis and process assumptions (cut-off approach, flowsheet concept and anticipated concentrate specifications); (D) the status and trajectory of permitting and approvals, infrastructure access and other site requirements; (E) market-related assumptions and the Project’s sensitivity and leverage to commodity pricing; (F) growth, conversion and expansion opportunities, including planned drilling and other technical programs; (G) the anticipated sequence of future studies, potential financing pathways and indicative timelines; and (H) the Project’s strategic positioning relative to regional and policy objectives. Such FLI is identified by, among other things, words such as ‘plans’, ‘expects’, ‘is expected’, ‘aims’, ‘budget’, ‘scheduled’, ‘estimates’, ‘forecasts’, ‘intends’, ‘anticipates’, ‘potential’, ‘target’, ‘opportunity’, ‘may’, ‘could’, ‘would’, ‘might’, ‘will’ and similar terminology, as well as statements regarding outcomes that ‘will’, ‘should’ or ‘would’ occur.
Material assumptions underlying the FLI include, but are not limited to: the accuracy of the 2025 MRE; geological continuity; the PEA-level capital/operating cost estimates (with typical PEA accuracy ranges); metallurgical recoveries and process performance consistent with test results to date; availability of labour, equipment and consumables at quoted/priced levels; access to grid power and water on contemplated terms; the ability to obtain land access, permits and approvals (including RECAPE) in a timely manner; tungsten pricing consistent with Argus long-term forecasts or stated sensitivity cases; foreign exchange and inflation consistent with study inputs; and availability of financing on acceptable terms. The Company believes these assumptions are reasonable as of the date hereof, but no assurance can be given that they will prove correct.
The PEA is preliminary in nature and includes Inferred Mineral Resources that are considered too speculative geologically to have the economic considerations applied to them that would enable them to be categorized as Mineral Reserves. There is no certainty that the PEA results will be realized. Mineral Resources are not Mineral Reserves and do not have demonstrated economic viability. Any reference to potential production, mine life, NPV, IRR, payback, costs, recoveries, or other economic or technical parameters is preliminary and conceptual.
Key risks and uncertainties that could cause actual results to differ materially from those expressed or implied by the FLI include, but are not limited to: (i) exploration, geological, modelling and grade-continuity risks, including the risk that further work does not confirm Inferred material or resource extensions; (ii) risks that metallurgical performance, WO₃ recoveries, concentrate quality or processing costs differ from test work and assumptions; (iii) capital cost escalation, schedule delays, contractor availability and supply-chain constraints; (iv) operating cost inflation (power, reagents, labour, transportation); (v) commodity price and FX volatility (including sustained periods below the Argus long-term or sensitivity prices assumed); (vi) permitting, environmental, social, community, land access and regulatory risks in Portugal (including RECAPE outcomes and permit conditions); (vii) water, tailings and geotechnical/hydrogeological risks inherent in underground operations; (viii) offtake, marketing and market-access risks for tungsten concentrates; (ix) availability and cost of equity, debt or project finance on acceptable terms; (x) changes in laws, regulations, taxes, royalties, or government policies; and (xi) other risks described under ‘Business Risks’ in the Company’s most recent MD&A and in other continuous disclosure filings available on SEDAR+. Readers are urged to carefully review those risk factors, which are expressly incorporated by reference into this cautionary note.
Non-GAAP Financial Measures
The Company has included certain non-GAAP financial measures in this press release. These financial measures are not defined under International Financial Reporting Standards (‘IFRS‘) and should not be considered in isolation. The Company believes that these financial measures, together with financial measures determined in accordance with IFRS, provide investors with an improved ability to evaluate the underlying performance of the Company. The inclusion of these financial measures is meant to provide additional information and should not be used as a substitute for performance measures prepared in accordance with IFRS. These financial measures are not necessarily standard and therefore may not be comparable to other issuers.
Net Present Value (NPV) – is the present value calculation of net profit from operations determined using a particular discount rate. All NPV values stated herein are on an after tax basis.
Internal Rate of Return (IRR) – is a financial metric used to assess an investment’s profitability by calculating the annual rate of return that makes the NPV of all cash flows (both positive and negative) equal to zero.
Payback – is calculated in years as the length of time that it takes to pay off the capital costs from annual net profit expected from operations at the Borralha Project.
Initial capital – is the initial capital cost amount required to be expended to construct the mine and tungsten concentrator process equipment and buildings to begin processing mineralized material into saleable tungsten concentrate at commercial quantities according to the life of mine plan at the Borralha Project. This is an estimate accurate to +/-35%.
Sustaining capital – is a supplementary financial measure which reflects cash basis expenditures which are expected to maintain operations and sustain production levels at the Borralha Project.
Capital costs – include the Initial capital and the sustaining capital.
Operating costs – are the costs required to process mineralized material into saleable tungsten concentrate at the Borralha Project. This includes: underground mining; processing and plant operations; general and administrative costs; and site services and infrastructure support. This can be calculated on the unit basis per mtu WO3 produced.
All-In Sustaining Costs (AISC) – are comprised of sustaining capital expenditures and site level costs to support ongoing operations and closure costs. All-in sustaining costs per mtu WO3 is calculated as AISC divided by the amount of mtu WO3 produced during the period that the costs are incurred. All-in sustaining costs capture the important components of the Company’s production and related costs and are used by the Company and investors to understand projected cost performance at the Borralha Project.
1 NPV(8%) = net present value at a 8% discount rate. NPV is a Non-GAAP measure; see notes below for additional information regarding NPV. USD = United States dollars. Canadian dollar (CAD) equivalents calculated used a foreign exchange rate of CAD $1.3658/USD.
2 IRR = internal rate of return. IRR is a Non-GAAP measure; see notes below for additional information regarding IRR.
3 mtu/WO3 = metric tonne unit of tungsten; WO3 is tungsten trioxide.
4 Initial capital is a Non-GAAP measure. see notes below for additional information regarding initial capital.
5 Payback is a Non-GAAP measure. see notes below for additional information regarding payback.
6 All-in sustaining cost (AISC); AISC is a Non-GAAP measure; see notes below for additional information regarding AISC.
7 Operating costs are a Non-GAAP measure; see notes below for additional information regarding operating costs.
8 All-in sustaining costs (AISC) is a Non-GAAP measure; see notes below for additional information regarding AISC.
9 Capital costs are a Non-GAAP measure; see notes below for additional information regarding capital costs.

To view the source version of this press release, please visit https://www.newsfilecorp.com/release/285820


 to ALS Canada Ltd. (‘ALS‘) since February 2024. ALS operates under a commercial contract with New Found Gold.