
 When the stock market seems to be drifting sideways without displaying a clear bullish or bearish bias, it’s normal for investors to get anxious. It’s like being at a crossroads, wondering whether to go left, right, or stay put.
The truth is nobody has a crystal ball, and predicting what the market will do next is a fool’s errand. Should you jump in and buy now, or wait for the price to dip lower? Instead of fretting over these questions, what you can do is empower yourself with the right tools to make informed decisions.
For one example, creating ChartLists is a terrific way to keep an eye on the charts that are important to you.
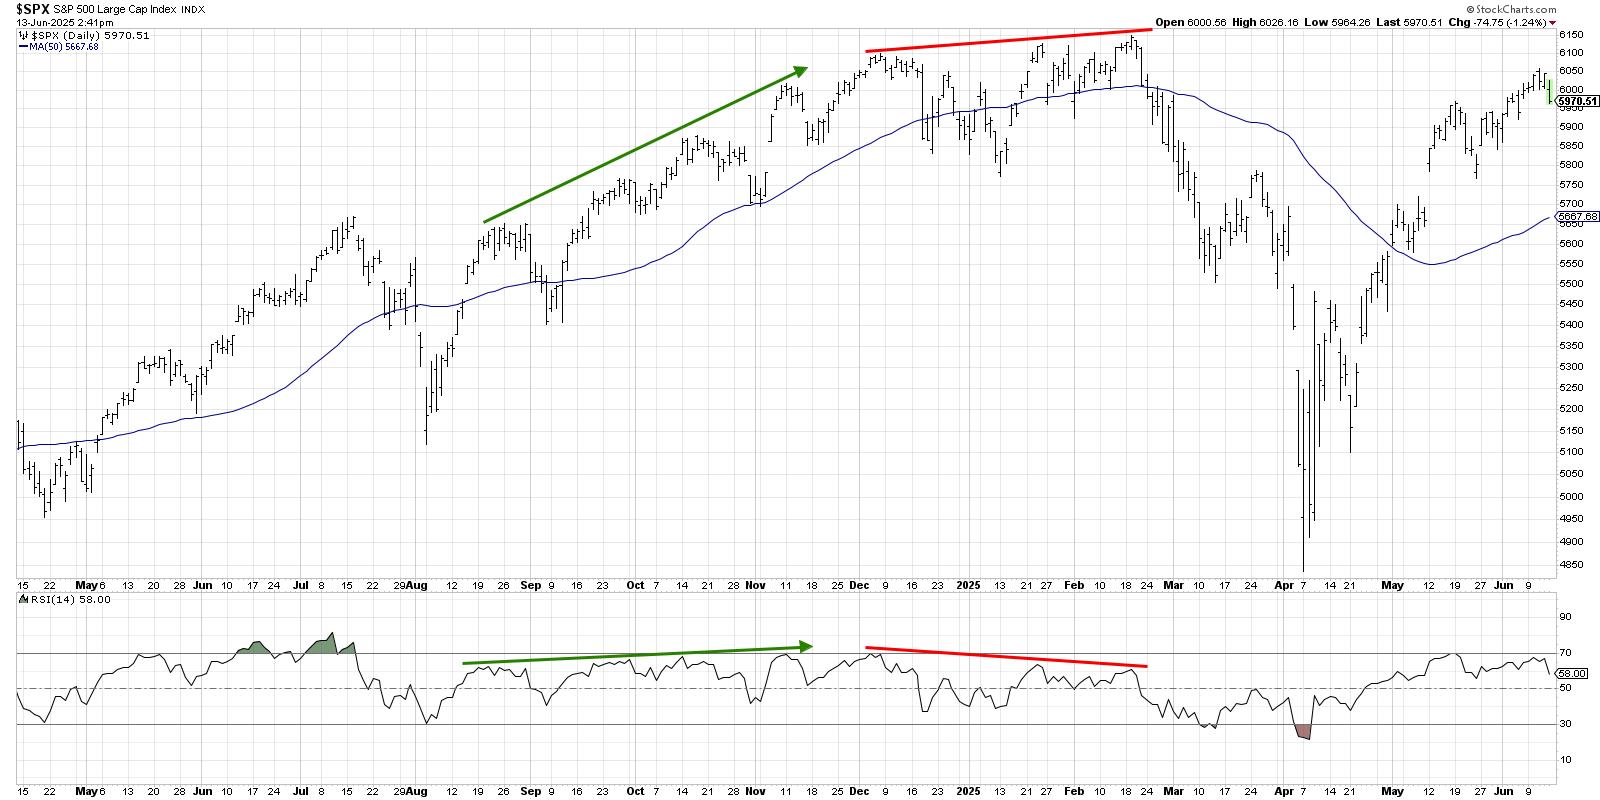
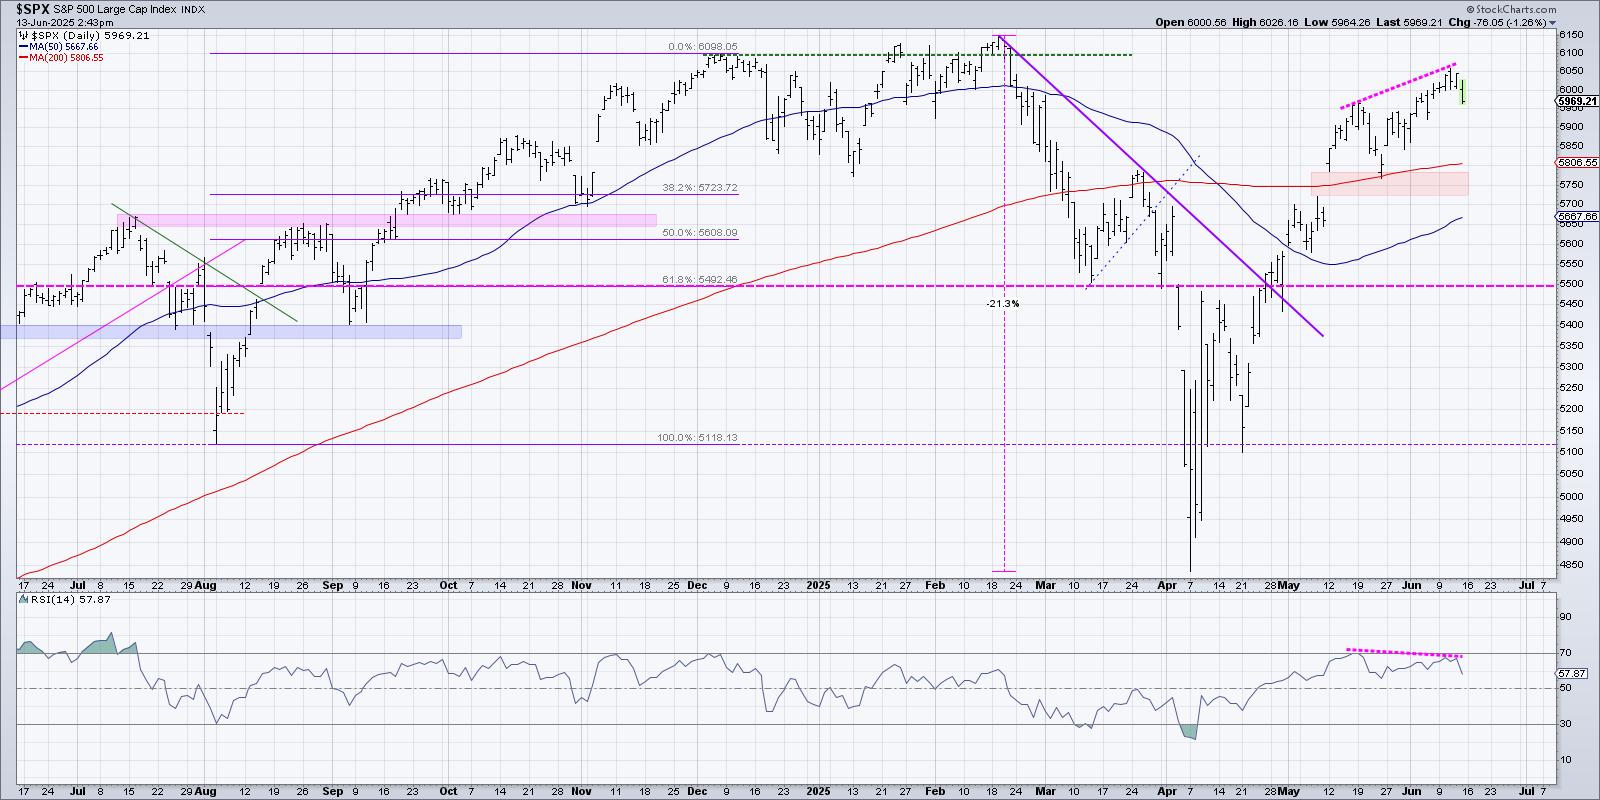
A logical starting point is to monitor a broad market index such as the S&P 500 ($SPX), which acts as a barometer for the overall health of the market. The chart from this week’s article “Navigate the Stock Market with Confidence” highlighted some important levels to monitor. The area between 5950 and 6050 is key; a break above or below these levels can signal what’s coming next.
Below is the chart of the S&P 500, with the key levels and updated to reflect the data after Wednesday’s close. Note that the index is still within the 5950 to 6050 range. Fed Chairman Jerome Powell’s press conference didn’t do much to move the market, although there was a bit of a selloff towards the close. But that’s nothing to be alarmed about. Active participants would have unloaded their positions ahead of Wednesday’s close due to the Middle East conflict and the market being closed on Thursday to observe Juneteenth.

FIGURE 1. DAILY CHART OF THE S&P 500. Monitor the price action at key support and resistance levels.Chart source: StockCharts.com. For educational purposes.
If the S&P 500 breaks below 5950, it could mean a further decline or a market reversal. On the other hand, if the index breaks above 6050, it could indicate a move towards new highs, or it could reverse after hitting its all-time high. With so many possible outcomes, navigating the stock market can feel like a puzzle.
This is where confirmation tools become your best friends. When the overall market is wavering, these tools provide that extra bit of confidence you need.
Take the McClellan Summation Index as an example. If you’re a regular reader of our weekly ChartWatchers newsletter (and if not, you should definitely check it out — it’s packed with insights), you might recognize the chart below from last week’s issue.
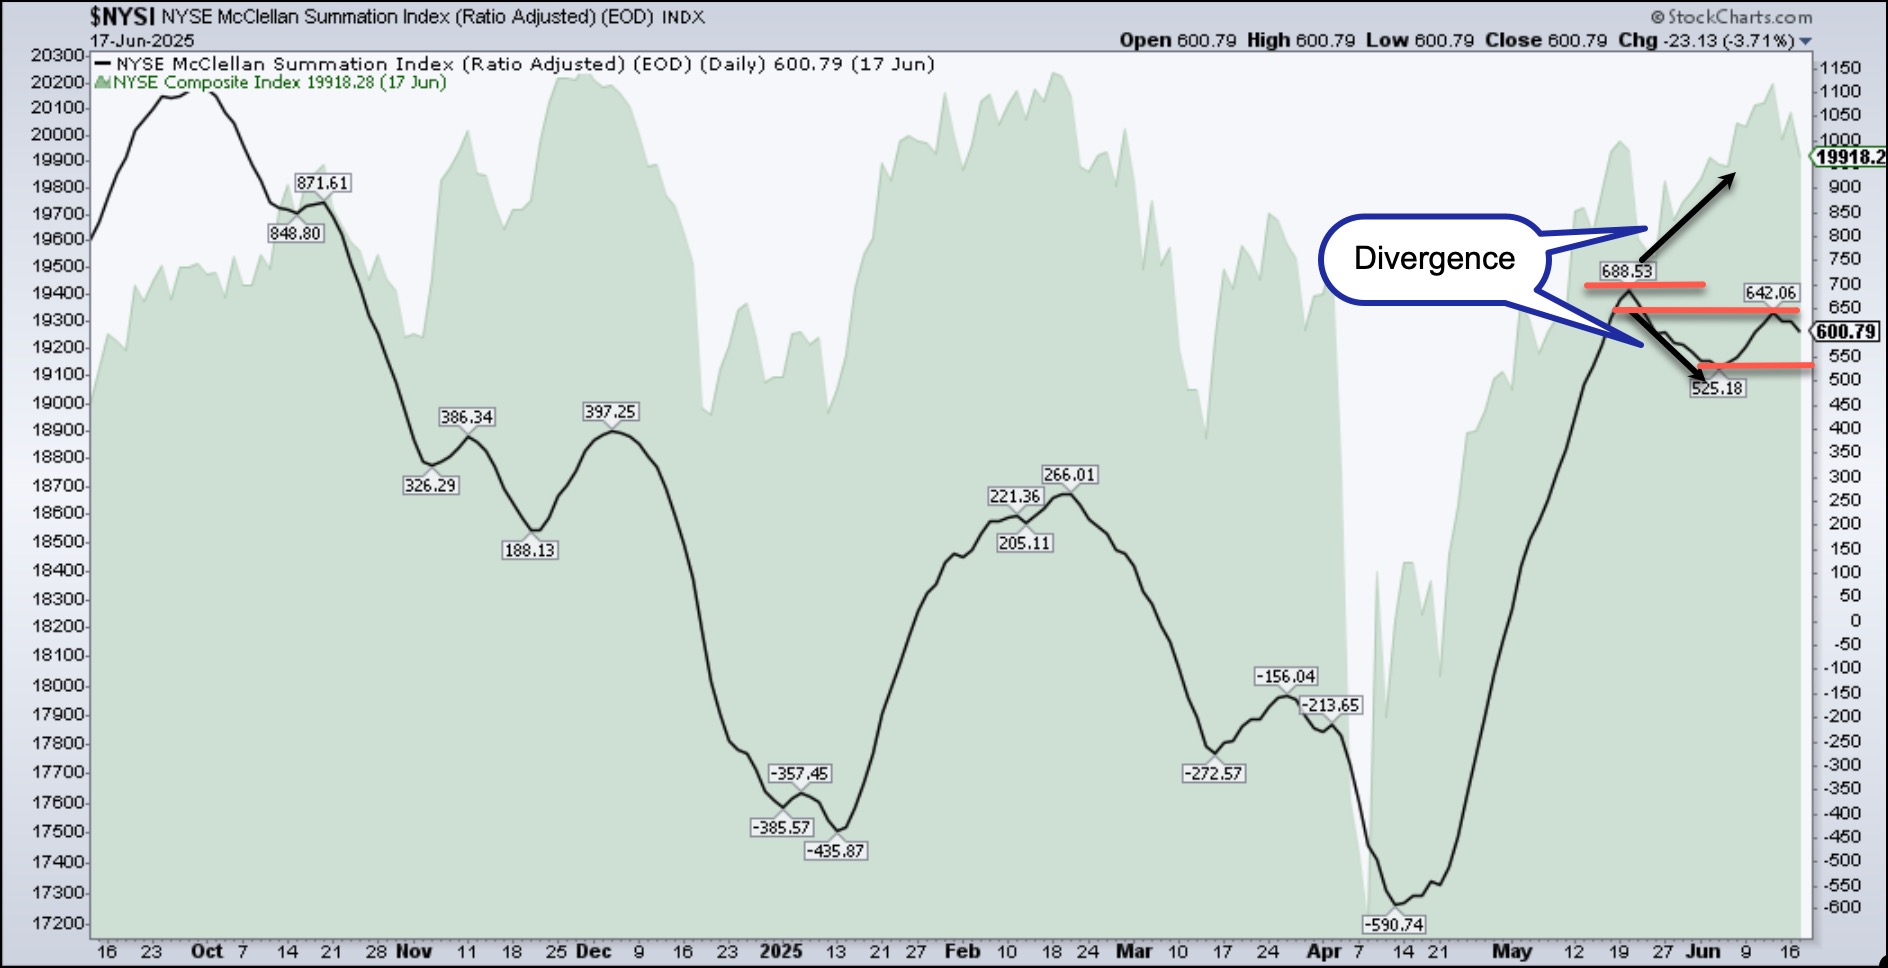
FIGURE 2. NYSE MCCLELLAN SUMMATION INDEX VS. THE NYSE COMPOSITE INDEX. Note the divergence between the two and the various levels (red horizontal lines). Chart source: StockCharts.com. For educational purposes.
This chart displays the NYSE McClellan Summation Index ($NYSI) overlaid on an area chart of the NYSE Composite Index ($NYA). The McClellan Summation Index tends to generate fewer signals, making it helpful for looking at medium and long-term trends. It helps to cut through the noise of an indecisive market and gives you a clearer picture.
Notice how, after its April low, the $NYSI climbed from -590 to 688 relatively quickly in sync with the NYSE. But here’s where it gets interesting: after hitting 688, there is a divergence. While the NYSE continued to move higher, the $NYSI started trending lower, making lower highs. This could be an early warning sign that the market’s upward momentum may be waning.
The McClellan Summation Index gives us some clear levels to monitor.
- Bearish scenario. If the S&P 500 falls below the 5950 level, followed by the $NYSI dropping below its last low of 525, then it’s likely equities could see further declines.
- Bullish scenario. If the S&P 500 breaks above the 6050 level, followed by the $NYSI moving higher than 642 and then the 688.50 level, it would be a positive sign for equities.
The Bottom Line
So if you’re wondering when might be a good time to “buy the dip” but are unsure about when that dip might occur, these types of charting tools can help guide your investment decisions. If your indicators line up and confirm an upward move, consider investing a portion of your capital and then adding more if the market continues to move in your favor. A big part of how well you manage your finances has to do with money management.

Disclaimer: This blog is for educational purposes only and should not be construed as financial advice. The ideas and strategies should never be used without first assessing your own personal and financial situation, or without consulting a financial professional.

 Grayson explores a hidden gem on the SharpCharts platform: StyleButtons! These handy little customizable tabs give you quick, one-click access to your favorite chart templates, allowing you to jump from ChartStyle to ChartStyle with a seriously streamlined charting workflow. Grayson demonstrates how to create and save ChartStyles and assign them to StyleButtons in your account – a major efficiency boost for all StockCharts users! Plus, he describes how he uses StyleButtons to make multi-timeframe analysis a breeze and explain his unique “indicator layering” approach to ChartStyles.
 Joe presents his game-changing “undercut and rally” trading pattern, which can be found in high volatility conditions and observed via RSI, MACD and ADX signals. Joe uses the S&P 500 ETF as a live case study, with its fast shake-out below support followed by an equally quick rebound; a good illustration of why lagging indicators can’t be trusted right after a vertical drop.
 Follow along with Frank as he presents the outlook for the S&P 500, using three key charts to spot bullish breakouts, pullback zones, and MACD signals. Frank compares bearish and bullish setups using his pattern grid, analyzing which of the two is on top, and explains why he’s eyeing SMCI and AMD as potential trades. From there, he wraps the show with a look at some ETF plays.
 When you see headlines about geopolitical tensions and how the stock market sold off on the news, it can feel unsettling, especially when it comes to your hard-earned savings. But what you might not hear about in the news is what the charts are indicating.
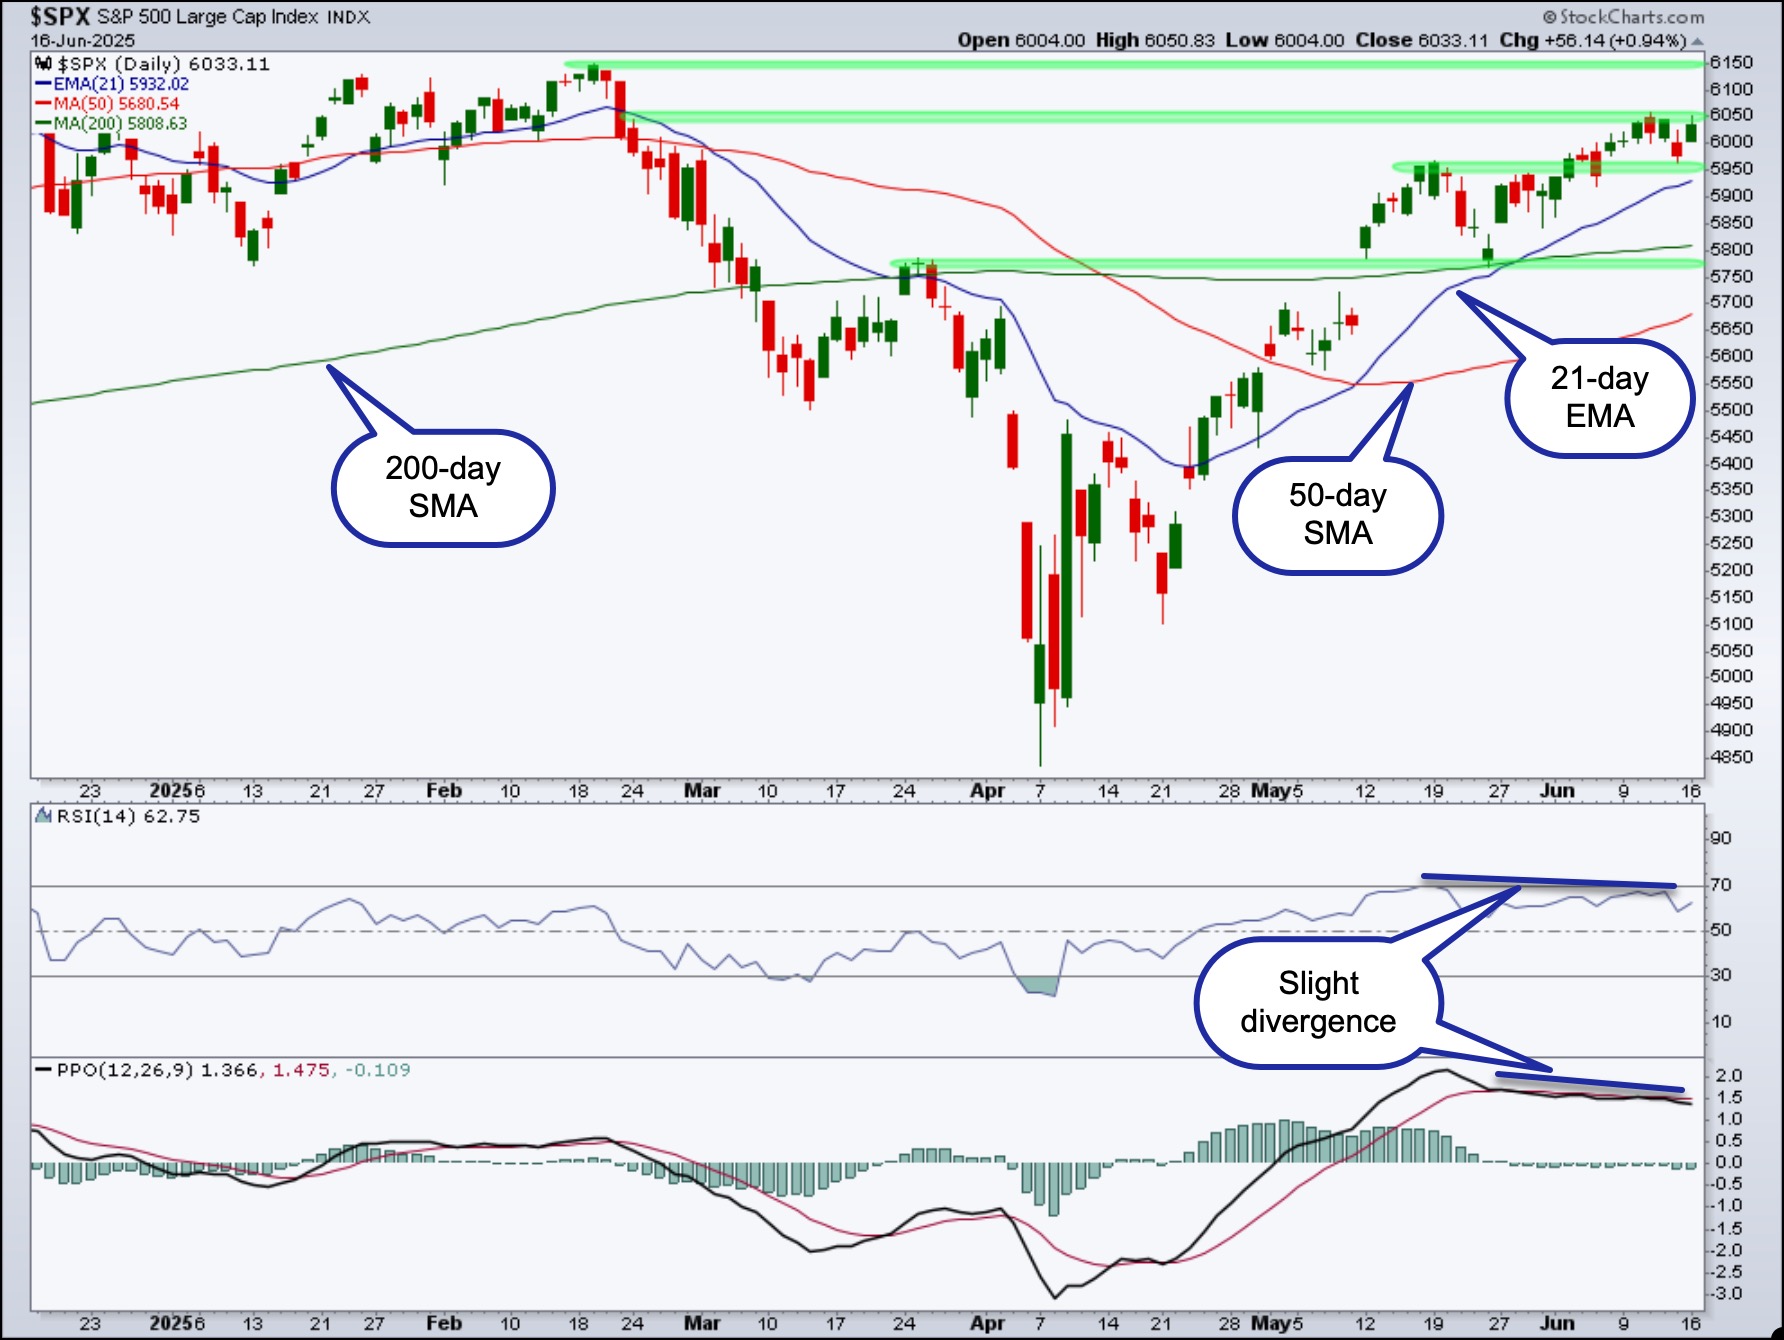


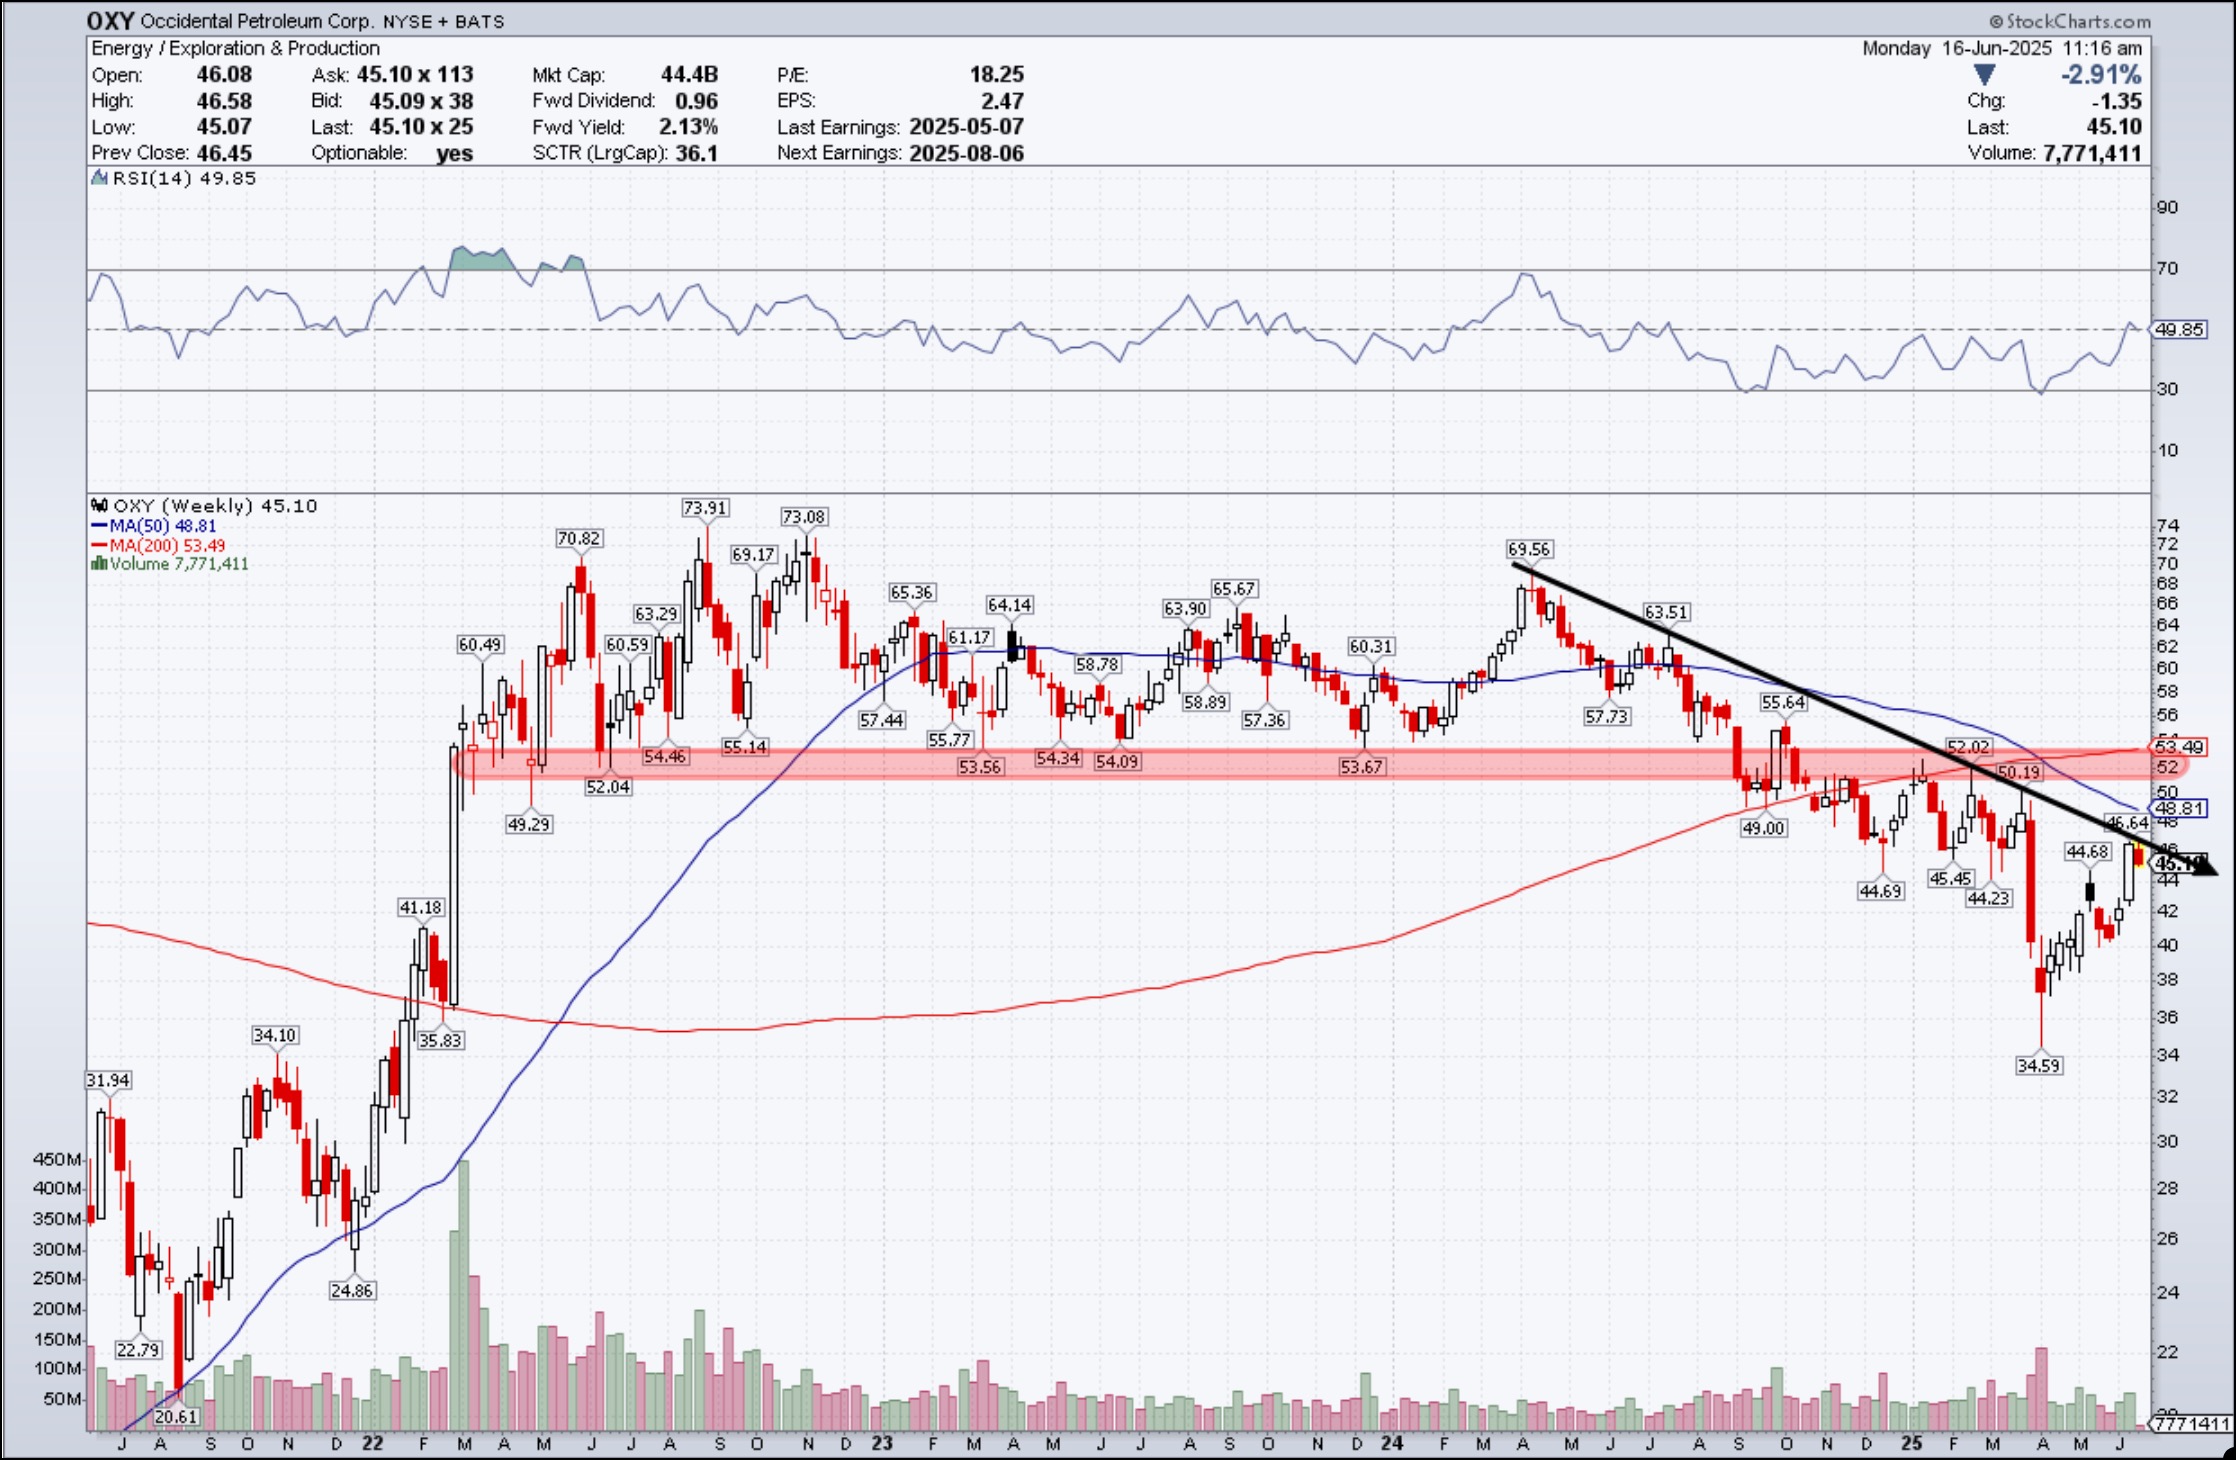
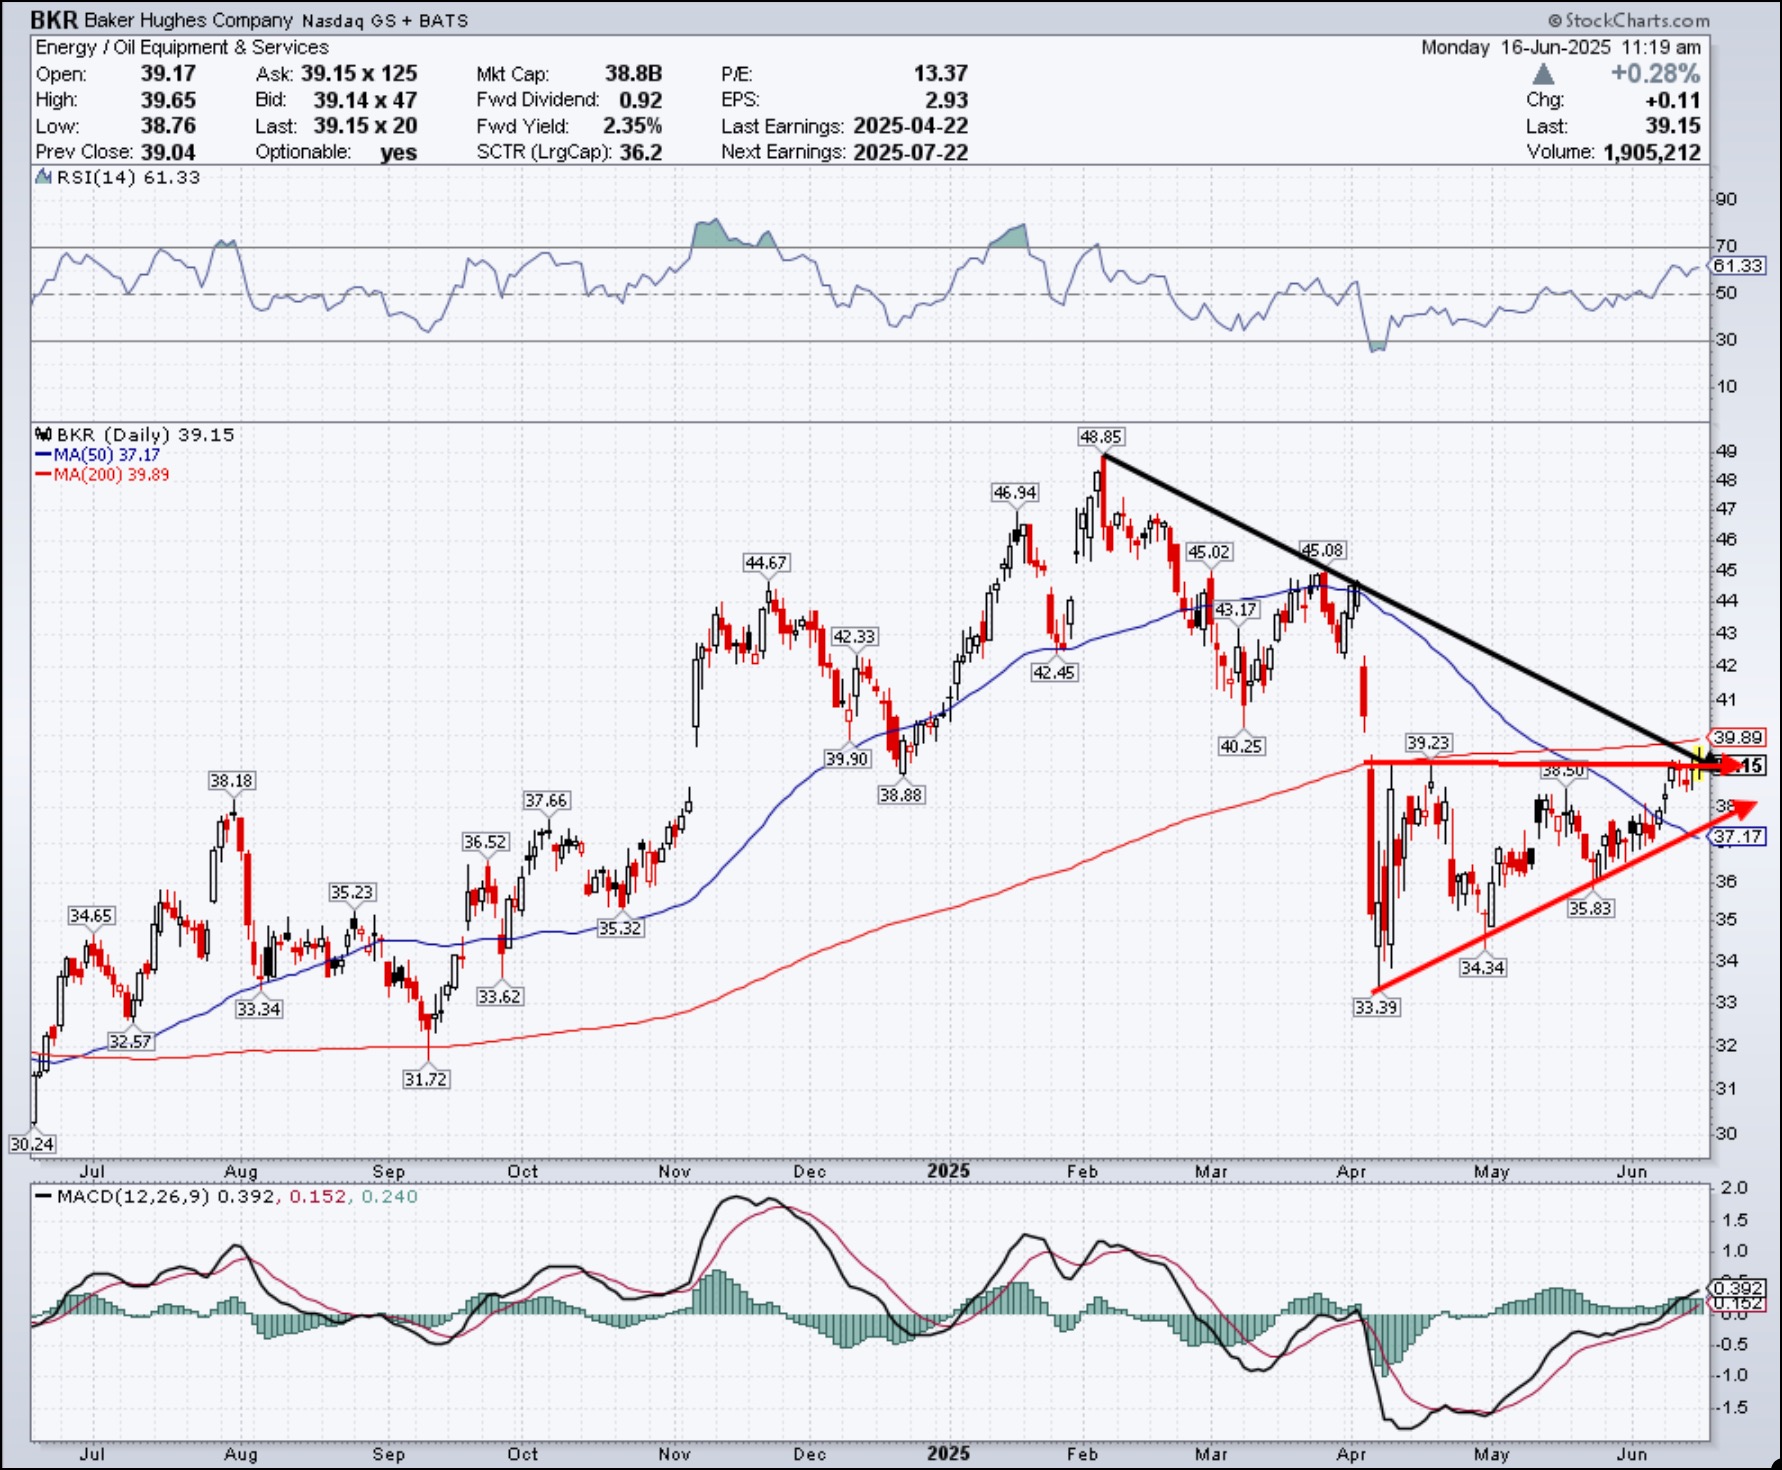
 With oil prices surging and geopolitical unrest stirring in the Middle East, it’s no surprise that energy stocks are drawing renewed attention. And, quite frankly, this week didn’t have many market-moving earnings. So this week, we skate to where the puck is, or, in this case, where traders’ eyes will be focused—the Energy sector.


 In this video